FIG 3.
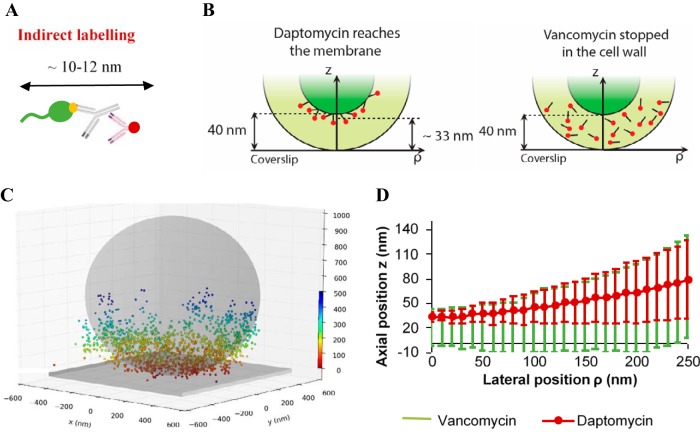
Daptomycin reaches the cytoplasmic membrane of S. aureus stationary-phase cells. (A) Antibody-based construction used to label daptomycin. In green, daptomycin; in yellow, the BODIPY-FL grafted on the cyclic decapeptide core of daptomycin; in gray, the anti-BODIPY-FL rabbit antibody; and in red, the AF647-fragment of goat antibody. (B) The two cases considered here are either localization at the cell membrane (daptomycin) or within the cell wall (vancomycin). (C) A typical 3D DONALD image acquired for stationary-phase cells. The colored scale bar represents the z position (nm). The gray sphere and plane represent the expected shape of the bacterium and the coverslip surface, respectively. (D) Daptomycin (red) and vancomycin (green) localization curves represent the axial positions (z) of the fluorescently labeled antibiotics as a function of their lateral positions (ρ). Error bars represent ± twice the standard deviation of the fluorescent probe distribution. It must be noted that total internal reflection fluorescence (TIRF) depth detection (∼300 nm) limits observations to the bottom side of each bacterium deposited on the substratum.

