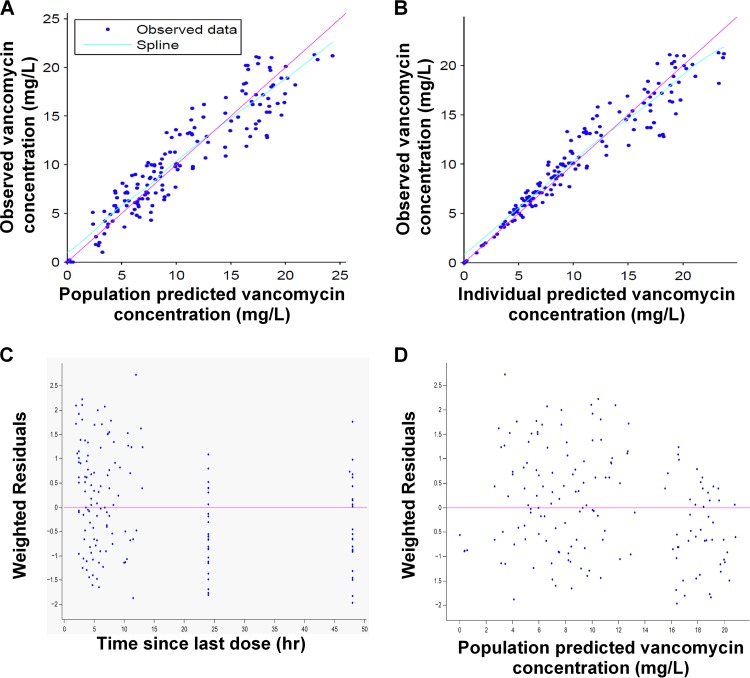
FIG 1.
GOF plots obtained from the final model for vancomycin. (A) Individual predictions of vancomycin versus observed concentrations. (B) Population predictions of vancomycin versus observed concentrations. (C) Weighted residuals versus time since last dose. (D) Weighted residuals versus population predicted concentrations.

