Figure 5.

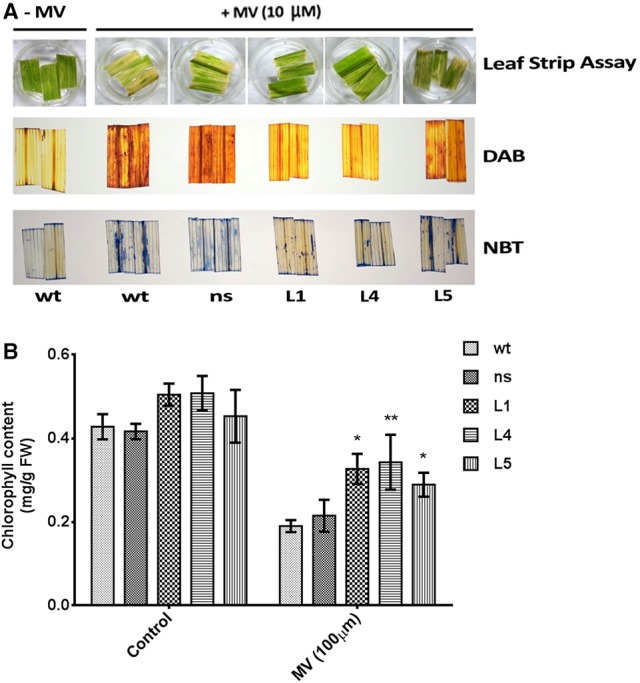
Assessment of tolerance of OsGS1;1/OsGS2 co-overexpressing transgenic rice to methyl viologen (MV) induced photo-oxidative stress. (A; top panel) Leaf strips of wt, ns, and three T2 transgenic lines (L1, L4, and L5) after photo-oxidative stress treatment (incubation in 10 μM MV). Untreated (–MV) wt was used as a control (A; middle panel) Histochemical assessment of in vivo H2O2 formation following MV treatment by DAB staining. (A; bottom panel) In vivo generation of O in leaf strips after MV treatment as detected by NBT staining. (B) Total chlorophyll contents (in mg/g FW) after MV treatment as compared to untreated controls. Data represented are means ± SD (n = 3). Asterisks above bars indicate significant differences from wt (*p-value ≤ 0.05 and **p-value ≤ 0.01).
