
Figure 1.
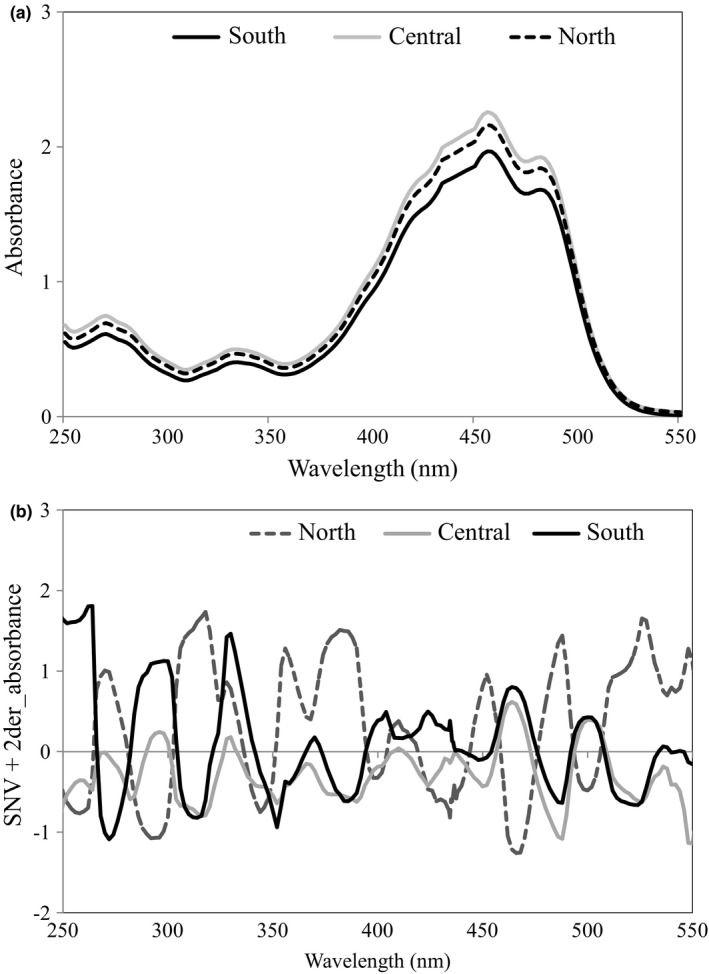
Illustration of UV‐vis spectra of palm oils: (a) Untreated and (b) SNV+2der‐treated spectra of palm oils of different regions (Central, North, and South)
Official websites use .gov
A
.gov website belongs to an official
government organization in the United States.
Secure .gov websites use HTTPS
A lock (
) or https:// means you've safely
connected to the .gov website. Share sensitive
information only on official, secure websites.
Illustration of UV‐vis spectra of palm oils: (a) Untreated and (b) SNV+2der‐treated spectra of palm oils of different regions (Central, North, and South)