
Figure 2.
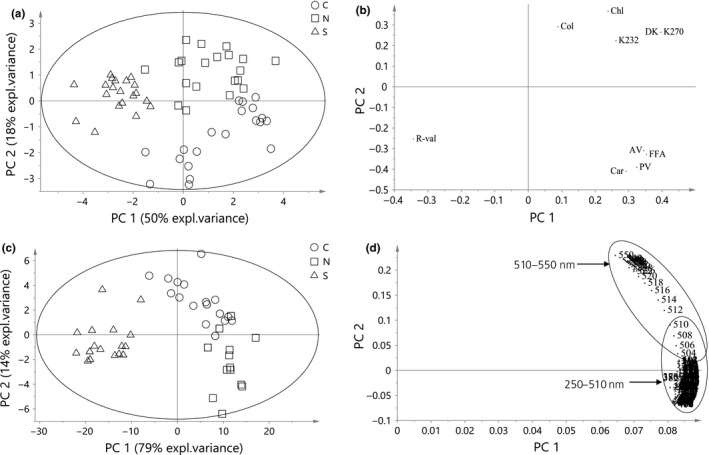
PCA model results: (a) score plot of quality parameters (b) loading plot of quality parameters (c) score plot of untreated spectral data, and (d) Loading plot of untreated spectral data of palm oils of different regions (Central C, North N, and South S)