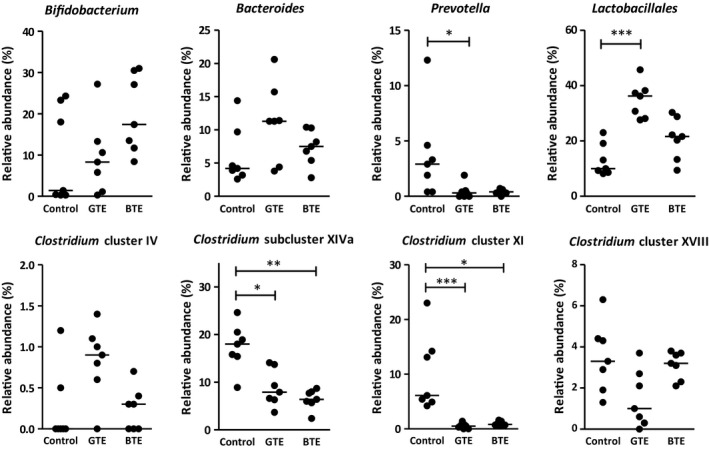
Figure 2.

Effect of GTE and BTE on the profile of fecal microbiota. Feces of rats fed either a control diet, a GTE (10 g/kg) diet, or a BTE (10 g/kg) diet were collected during the third week of feeding. Values are expressed as percentages of the peak area of a particular OTU to the total peak area of all OTU. Horizontal bars indicate median (n = 7). Asterisks indicate statistical significance: *p < .05, **p < .01, ***p < .001
