Figure 5.

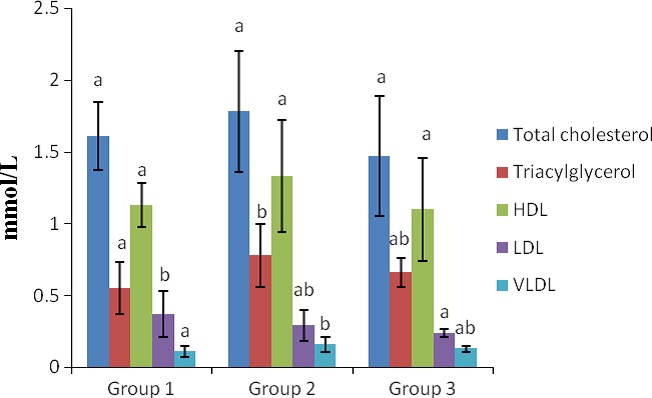
Lipid profile in the sera of rats. a–b Means with different superscripts are significantly different for each group (p < .05). Groups 1, 2, and 3 represent the study groups 1 and 2 and the control groups, respectively

Lipid profile in the sera of rats. a–b Means with different superscripts are significantly different for each group (p < .05). Groups 1, 2, and 3 represent the study groups 1 and 2 and the control groups, respectively