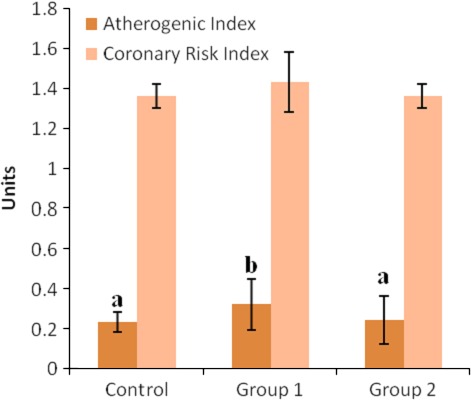
Figure 6.

Atherogenic and coronary risk indices of rats. a–b Means with different superscript letters are significantly different across the groups (p < .05). Means without superscript letters are not significantly different across the groups (p > .05). Groups 1, 2, and 3 represent the study groups 1 and 2 and the control groups, respectively
