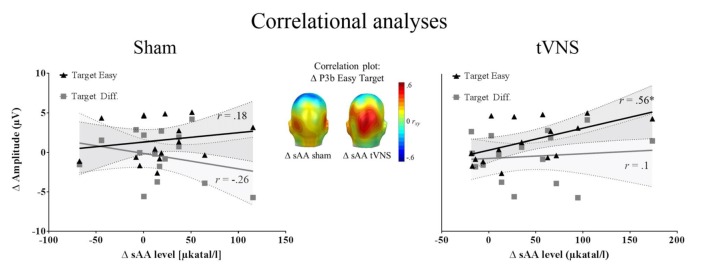
Figure 2.
Correlation analysis (N = 16). Left and right: zero-order correlations between the increase P3b amplitudes for tVNS compared to sham condition and the increase in salivary alpha-amylase (sAA) during stimulation for sham (left) and tVNS (right) conditions. The target easy condition is represented in black and the target difficult condition in dark gray. Shaded areas represent the confidence intervals of the correlations. Middle: correlation of the above mentioned variables for the easy target condition, across electrodes, showing that the highest correlation matches spatially with the P3b location.

