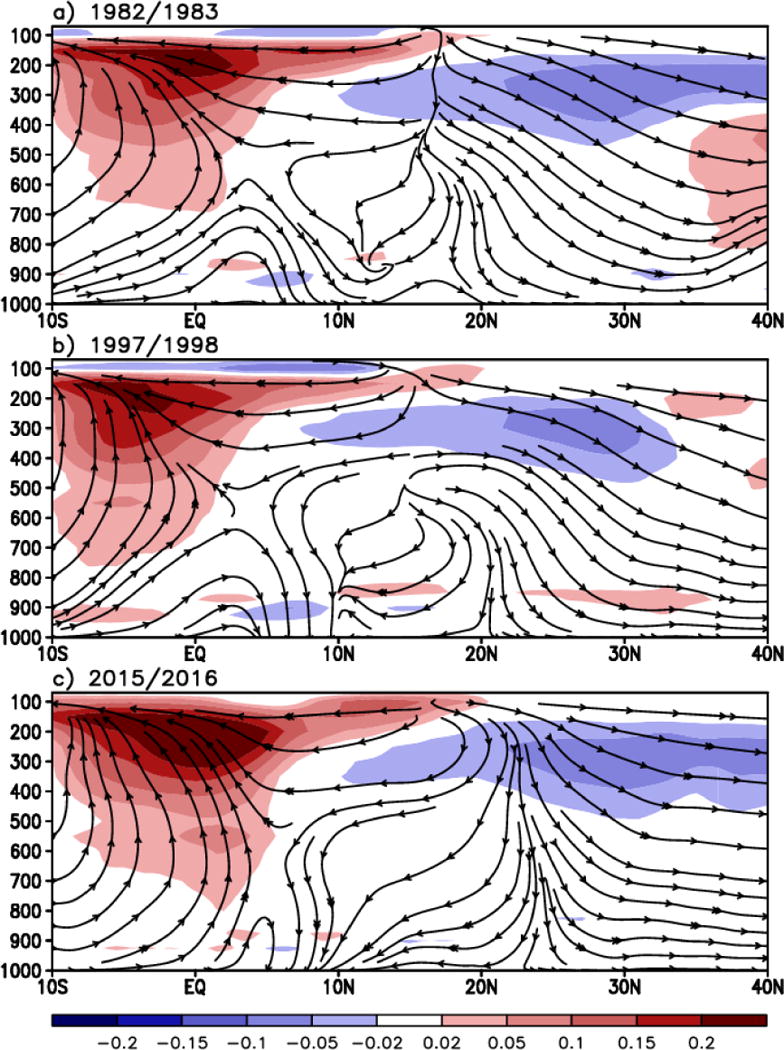
Figure 13.

Latitude-pressure sections showing the Hadley circulation (streamline) and total cloud fraction anomalies (shaded), averaged over the longitude range between 150°W and the dateline. Plots are shown for the boreal winters of (a) 1982/1983, (b) 1997/1998, and (c) 2015/2016.
