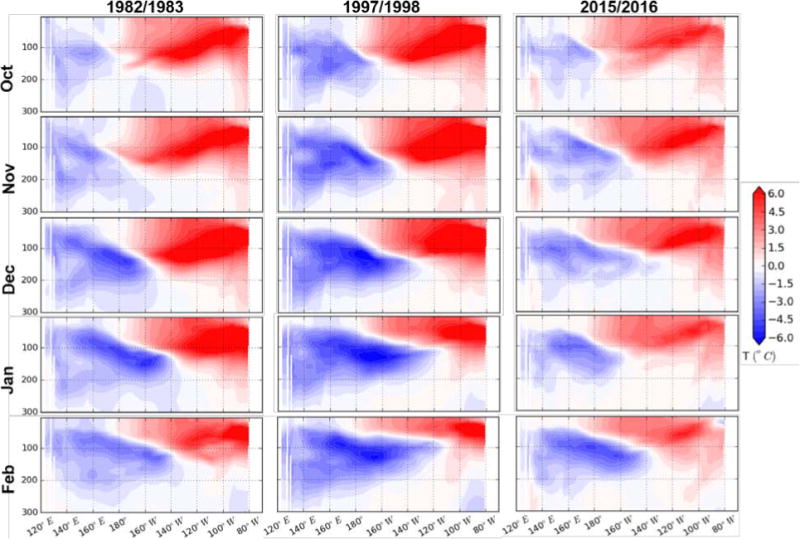
Figure 17.

Sub-surface water temperature anomalies [°C] along the equatorial Pacific for the 1982/1983 (left), 1997/1998 (middle), and 2015/2016 (right) ENSO events as the El Niño approaches maturity from October (top) to the beginning of the decay (bottom). The y-axis on the sub-surface water temperature anomaly pattern is the ocean depth in meters.
