
Figure 19.
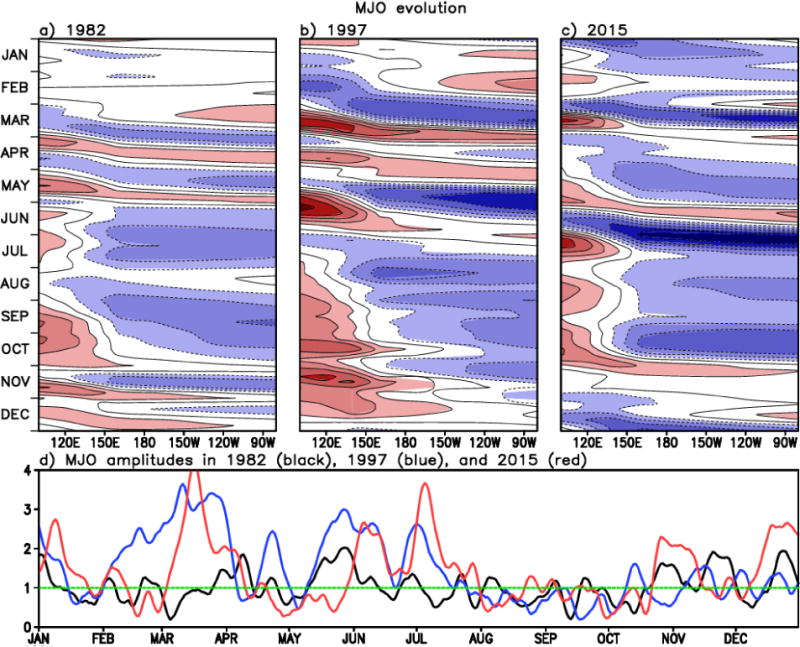
Upper: Time evolution of the MJO propagation along the equatorial Pacific for the period 1982 (left), 1997 (middle), and 2015 (right). The blueish (reddish) color represents the enhanced (suppressed) MJO-related convection. Lower: Time series of the MJO amplitude from the Wheeler and Hendon index. Black, blue, and red curve represents 1982, 1997, and 2015, respectively. The x-axis represents longitude whereas the y-axis is the time in month.