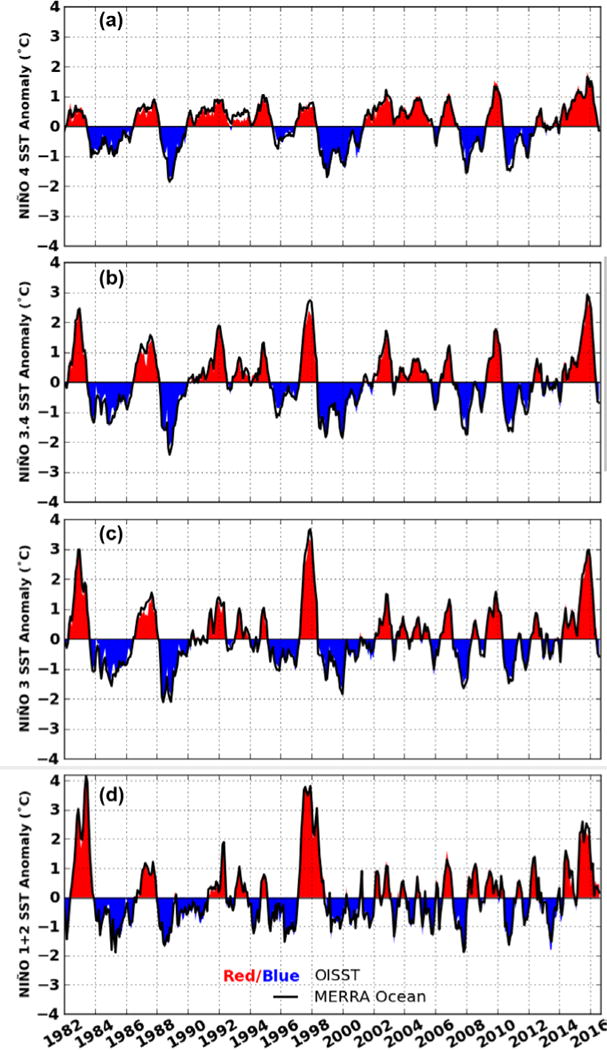
Figure 2.

Time series of sea surface temperature (SST) anomaly averaged over a) Niño 4, b) Niño 3.4, c) Niño 3, and d) Niño 1+2 regions for the period 1982–2016. The red/blue shaded curves show the Reynolds OISST while the solid curve represents the analyzed values from GEOS-5 MERRA-Ocean.
