
Figure 1. Global Comparison of Detection of Desthiobiotinylated Peptides from Kinases Across Data Acquisition Approaches.
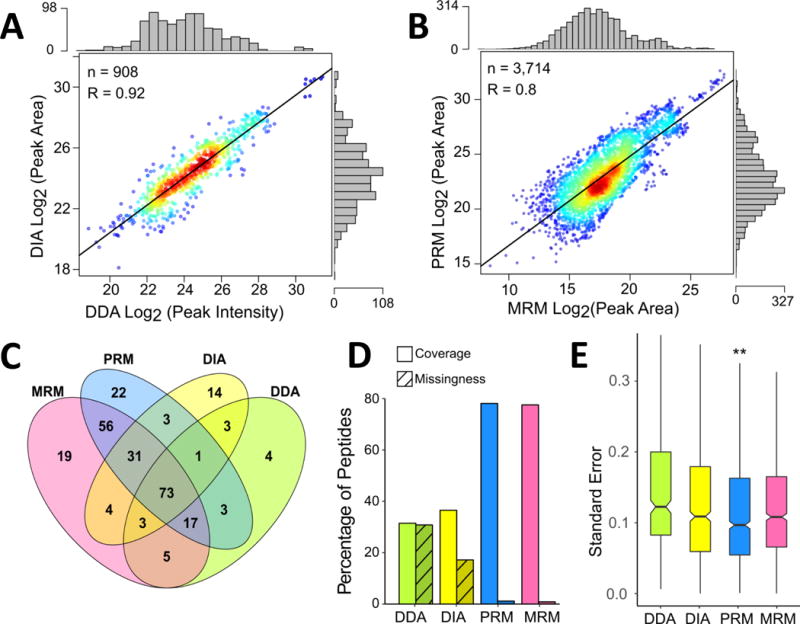
Correlation between log2 transformed peak area or intensity values following IRON normalization for desthiobiotinylated kinase peptides detected in DDA and DIA LC-MS/MS experiments (A). Comparison of peak areas for detected kinase peptides in LC-MRM and LC-PRM datasets (B). In both panels, each point represents a specific peptide measurement in a single replicate and the marginal distribution of measurements across the log2 transformed peak areas or intensities is shown as histograms on the opposite axis. R values are calculated for Pearson correlation and p-values < 0.001. Venn diagram (C) comparing the numbers of kinases detected and quantified by each method. Assessment of kinase peptide detection and data missingness across platforms (D). Coverage is defined as the percentage of peptides quantified in each method compared to the total identified across all MS methods. Missingness is the percentage of missing values for peptides detected with each method. Boxplots showing the distribution of standard errors for means of log2 fold-change ratios following drug treatment (E). Outliers were removed from the boxplots to retain scale. (**: p-value < 0.01, calculated using a paired t-test, compared to each other method).