
Figure 5. Pathway Map Annotated with Detection and Quantification of Changes in Desthiobiotinylated Kinase Peptides in Response to BEZ-235 Treatment.
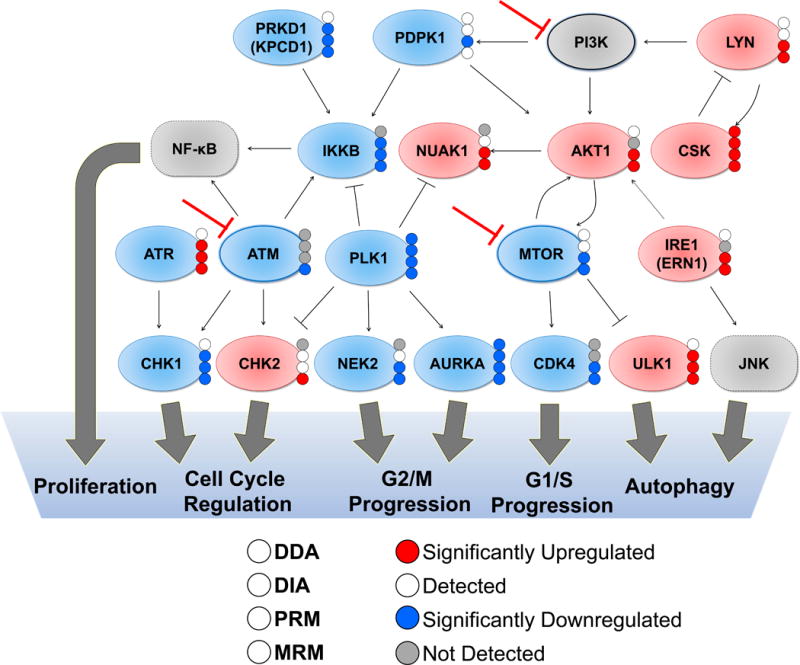
Schematic diagram of protein-protein interactions and downstream processes of a subset of kinases with differentially regulated probe labeling at 24 hours after BEZ-235 treatment. Proteins included had at least one peptide significantly increasing or decreasing (with an average fold-change > 1.6 or < −1.6 and p-values < 0.05 using student’s two tailed t-tests. Known BEZ-235 targets (ATM, MTOR, PI3K) are indicated with the red inhibition arrow. Proteins with red fill colors are increasing while those with blue fill colors are decreasing, and grey proteins are not detected in the dataset, but are included as known mediators of downstream signaling. The colored dots on the right of each protein indicate quantification results specific to each method, as indicated in the legend.