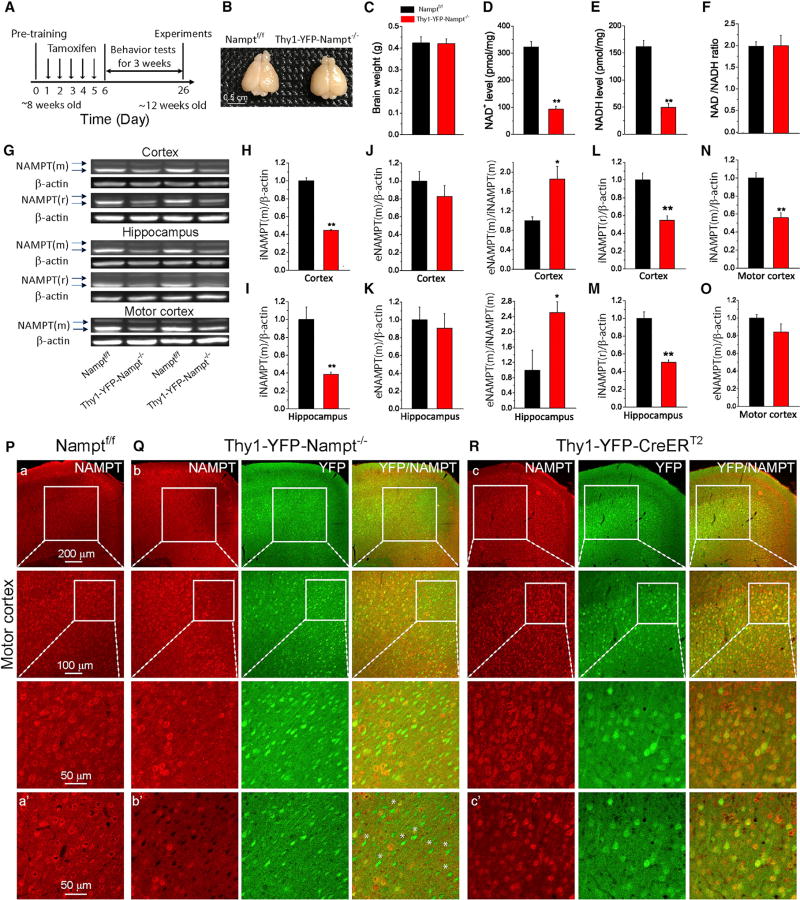
Figure 1. Characterization of Thy1-YFP-Nampt−/− cKO Mice.
(A) Timeline for experimental design.
(B and C) Photograph (B) and average brain weights (C) (N = 4).
(D–F) Cortical NAD+ (D) and NADH (E) levels and NAD+/NADH ratio (F) (N = 6). **p < 0.01, t test.
(G) Western blots for NAMPT using mouse and rabbit anti-NAMPT antibodies. Upper and lower arrows indicate eNAMPT and iNAMPT, respectively. NAMPT(m) and NAMPT (r) were NAMPT detected by mouse and rabbit antibodies, respectively.
(H–K) iNAMPT(m) and eNAMPT(m) levels in cortex (H and J) and hippocampus (I and K) and eNAMPT(m)/iNAMPT(m) ratios.
(L and M) iNAMPT(r) levels in cortex (L) and hippocampus (M).
(N and O) iNAMPT(m) (N) and eNAMPT(m) (O) levels in the motor cortex.
In (H)–(O), N = 4 mice. *p < 0.05; **p < 0.01, t test. Data are expressed as means ± SEM.
(P–R) Immunofluorescent images showing NAMPT expression in the motor cortex using a rabbit antibody; (P) Namptf/f, (Q) Thy1-YFP-Nampt−/−, and (R) Thy1-YFP-CreERT2. (a–c) Epi-fluorescent images (top row) and confocal maximal projection images (second and third rows). (a’–c’) Confocal single-frame images. White asterisks indicate YFP+ but NAMPT− cells. Error bars represent ± SEM. Notice that most of the YFP+ cells in the motor cortex were NAMPT− in Thy1-YFP-Nampt−/− mice.
See also Figure S1.

