. 2016 May 26;7(8):5508–5516. doi: 10.1039/c6sc00974c

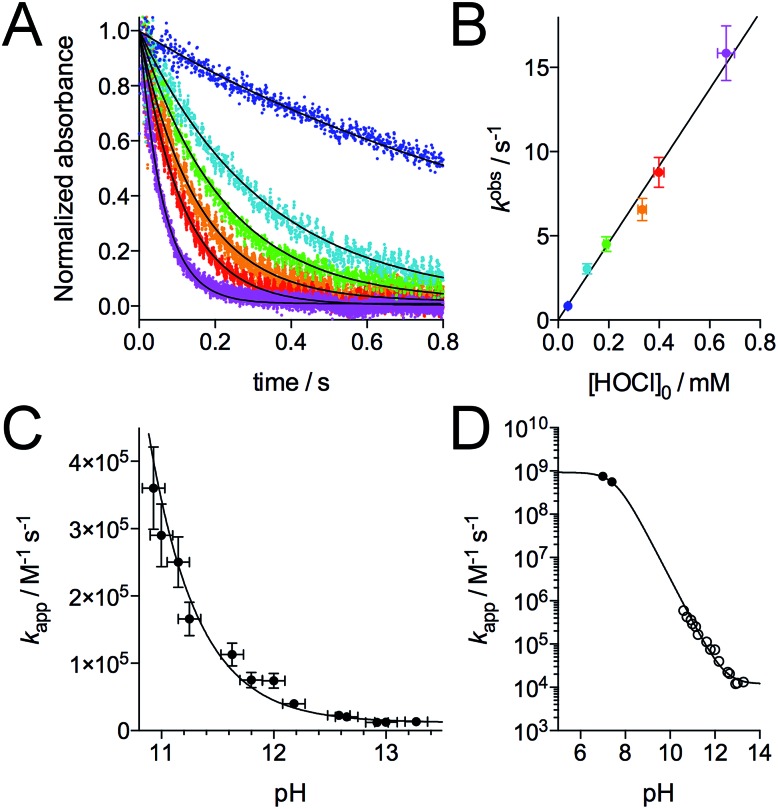
Fig. 4. Kinetics of the reaction of Zn·LHSP with HOCl. (A) Stopped-flow absorbance monitoring (λ = 230 nm) of the reaction at pH 12.6 (298 K) with various concentration of HOCl (monoexponential fits are shown as solid lines). (B) Plot of the observed first order rate constant kobs derived from monoexponential fits of kinetic traces against the concentration of HOCl. The slope of the linear regression yielded kapp = (2.3 ± 0.4) × 104 M–1 s–1 at pH 12.6. (C) pH-Dependence of kapp in the high-pH region. (D) pH-Dependence of kapp between pH 5 and 14 showing kapp values determined by stopped-flow measurements (open circles) and by competitive titrations of Zn·LHSP and methionine by HOCl (black circles). The solid lines in (C) and (D) correspond to the fit of the pH-dependence of kapp using eqn (4). The fit over the whole pH range yielded k(Zn·LHSP + HOCl) = (9.3 ± 0.8) × 108 M–1 s–1 and k(Zn·LHSP + ClO) = (1.2 ± 0.2) × 104 M–1 s–1.

Fig. 4