. 2016 May 26;7(8):5508–5516. doi: 10.1039/c6sc00974c

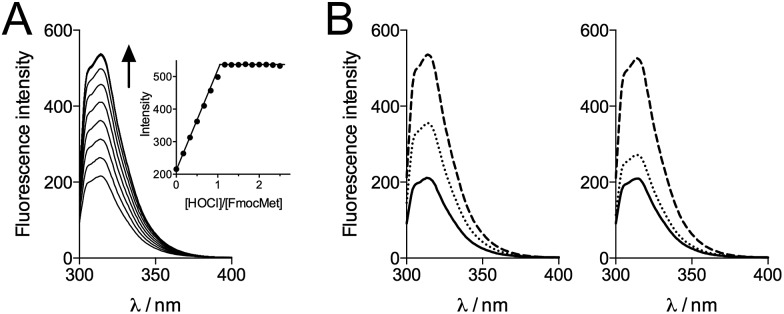
Fig. 7. (A) Fluorescence monitoring (λex = 265 nm) of the oxidation of FmocMet (20 μM) by HOCl at pH 7.4 in a phosphate buffer (10 mM, 298 K). The inset shows the intensity of the emission at 314 nm against added HOCl equivalents. (B) Competitive oxidation of FmocMet and Met by HOCl at pH 7.4 monitored by fluorescence (λex = 265 nm) in a phosphate buffer (10 mM, 298 K): fluorescence spectra of solutions of FmocMet (20 μM) in the absence (left panel) and presence (right panel) of Met (20 μM). Solid, dotted and dashed lines correspond to spectra recorded before addition of HOCl, after addition of HOCl (10 μM) and after addition of excess HOCl, respectively.

Fig. 7