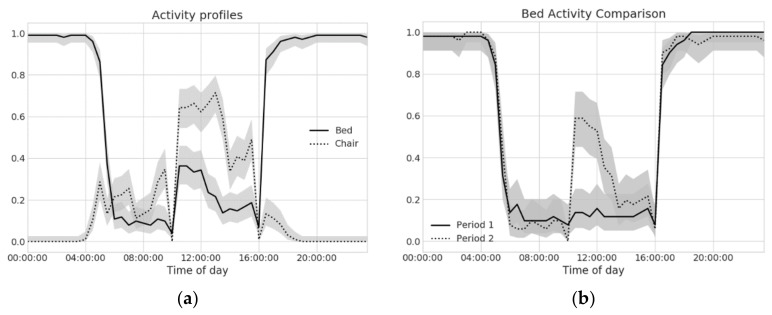
Figure 4.
(a) Sensor profiles for bed and chair sensors. The shaded area represents the 95% confidence interval of the estimated sensor profile values; and (b) a comparison of bed SP for two consecutive periods (20 days each). Non-overlapping confidence intervals indicate statistically significant differences, indicating underlying behavioral changes. In this case, bed presence is significantly increased right after lunch (time in UTC).

