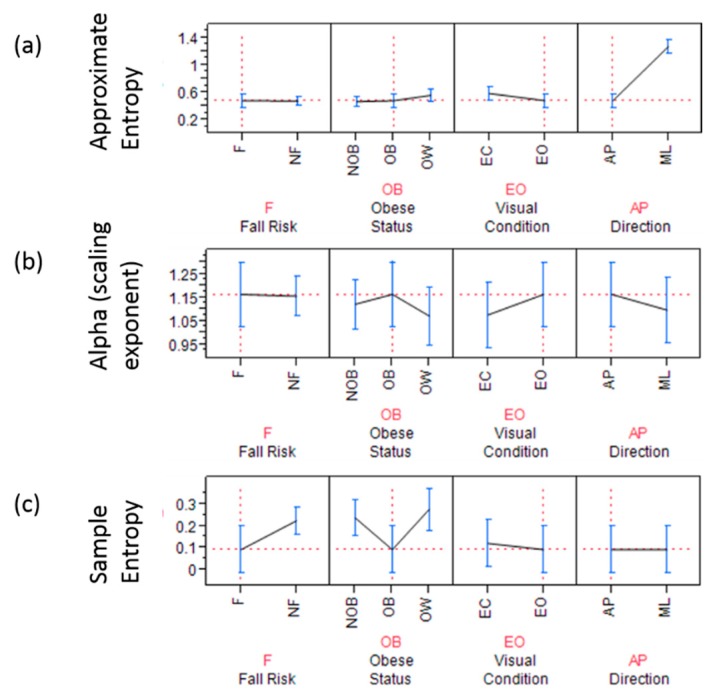
Figure 3.
Forceplate signal based non-linear analysis showing (a) approximate entropy; the graph highlights (dashed red line) obese fallers have significantly lower complexity in anterior posterior direction with eyes open condition; (b) scaling exponent α and; the graph highlights (dashed red line) that obese fallers have significantly higher scaling exponents in anterior posterior direction during eyes open condition (c) sample entropy is significantly lower for AP time series derived from forceplate for fallers with obesity in eyes open condition (red dashed lines).

