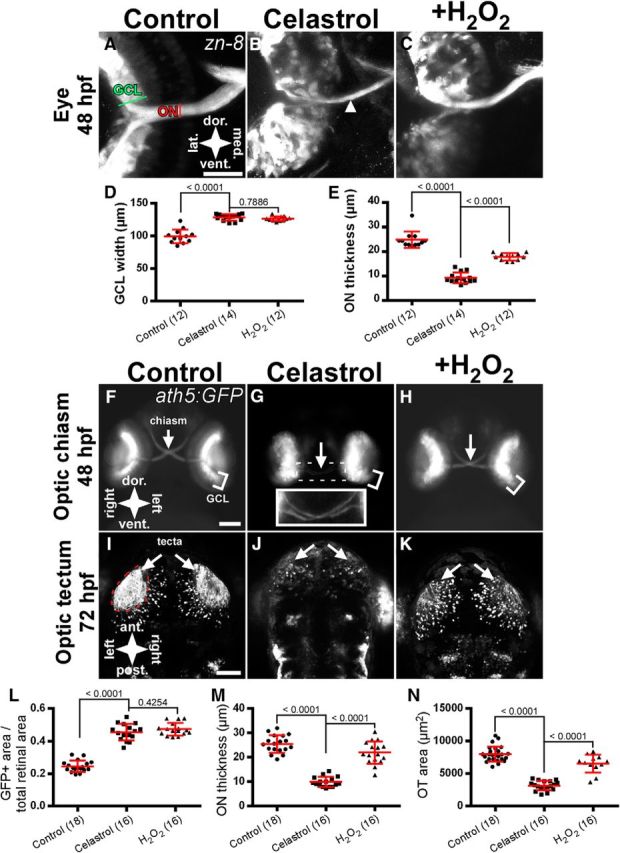
Figure 1.

Nox inhibition causes defects in retinal development and tectal innervation. A–C, Retinal micrographs of 48 hpf embryos labeled with the RGC marker zn-8 after a 4 h treatment with 0.1% DMSO (A) or 2.5 μm celastrol (B, C). Embryo in C was incubated with 2 mm H2O2 after drug washout. White arrowhead in B indicates ON thinning. D, Graph of GCL width in zn-8-labeled embryos treated with celastrol. E, Graph of ON thickness in zn-8-labeled embryos treated with celastrol. F–H, Anterior views of 48 hpf Tg(ath5:GFP) embryos after treatment with DMSO (F) or celastrol with (H) or without (G) subsequent H2O2 incubation. Inset in G shows the optic chiasm. I–K, Dorsal views of control (I), inhibitor-treated (J), and H2O2 rescue (K) embryos in 72 hpf embryos showing optic tectum innervation. White arrows indicate the optic chiasm (F–H) or optic tecta (I–K). L, Graph of GFP-positive area corresponding to the GCL divided by total retinal area in Tg(ath5:GFP) embryos treated with celastrol. M, Graph of ON thickness in Tg(ath5:GFP) embryos treated with celastrol. N, Graph of OT area in Tg(ath5:GFP) embryos treated with celastrol. Scale bars, 50 μm (A–C) and 100 μm (F–K). All graphs show mean ± SD. Numbers in parentheses indicate the number of embryos analyzed. p-values from Tukey's HSD tests are reported above comparison bars.
