Figure 3.

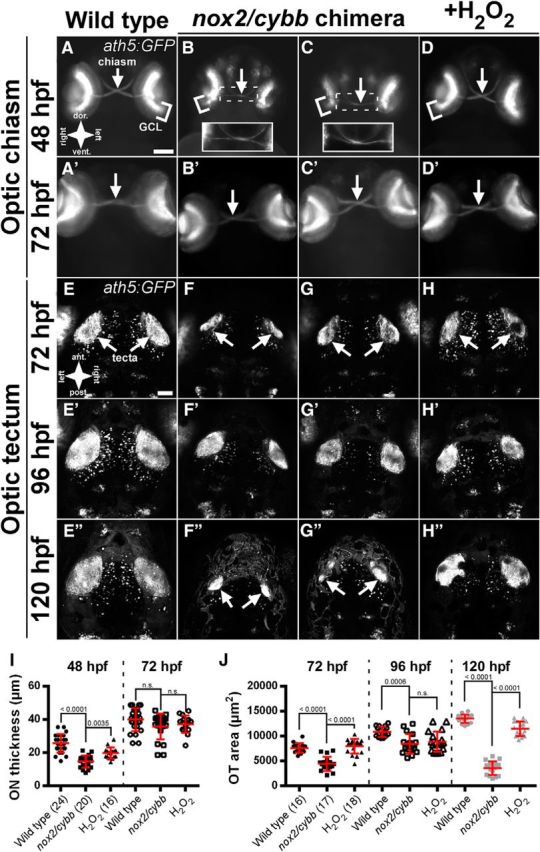
ON formation and OT innervation are impaired in chimeric nox2/cybb mutants. A–D, Anterior views of nox2/cybb chimeras at 48 hpf showing the formation of the optic chiasm. Insets in B and C show enlarged and enhanced views of the chiasm. A′–D′, Same samples as in A–D imaged at 72 hpf showing recovery of ON outgrowth in chimeras. E, F, Dorsal views of nox2/cybb chimeras at 72 hpf showing the innervation of the optic tecta. The same samples were imaged at 96 (E′–H′) and 120 hpf (E′′–H′′) to assess the extent of recovery. White arrows indicate the optic chiasm (A–D′) or optic tecta (E–H′′). Scale bars: A–D′, 100 μm; E–H′′, 50 μm. I, Graph of ON thickness in Tg(ath5:GFP)-positive, nox2/cybb chimeric mutants. J, Graph of OT area in Tg(ath5:GFP)-positive, nox2/cybb chimeric mutants. Numbers in parentheses indicate the number of embryos analyzed. Graphs show mean ± SD. p-values from Tukey's HSD tests are reported above comparison bars. n.s., No significant difference.
