Figure 8.

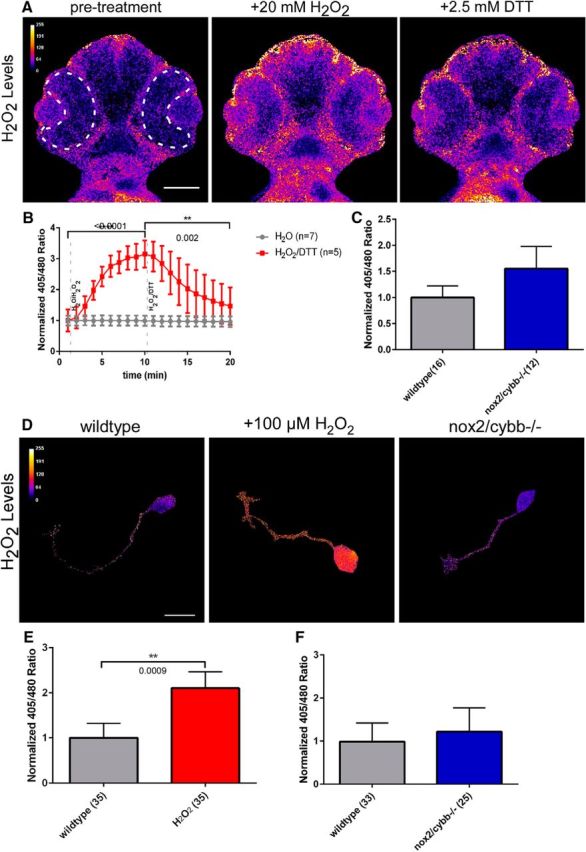
H2O2 levels in retinas of homozygous nox2/cybb−/− mutants. A, Ratiometric images depicting H2O2 levels in the head of a 48 hpf WT zebrafish embryo expressing roGFP2-orp1, before (left), 10 min after 20 mm H2O2 (middle), and 10 min after 2.5 mm DTT (right) addition. Dashed white line demarks retina, in which H2O2 levels were quantified in B and C. Scale bar: 100 μm. B, Graph showing the normalized 405/480 ratios of WT embryos at 1 min intervals in response to either H2O2/DTT (red line; n = 5 embryos) or H2O (gray line; n = 7 embryos) addition. Data are presented as mean ± SEM. p-values are indicated for paired t tests between H2O and H2O2 (p < 0.0001) and H2O2 and DTT (p = 0.002). C, Bar graph showing the basal H2O2 levels in retinas of WT (n = 16) and nox2/cybb−/− mutant (n = 12) embryos. nox2/cybb−/− mutant embryos do not have significantly different H2O2 levels compared with WT embryos (p = 0.2675, unpaired t test with Welch's correction). D, Representative ratiometric images of cultured WT RGC neurons treated with serum-free control medium (left), treated for 30 min with 100 μm H2O2 (middle), and cultured nox2/cybb−/− mutant RGC neuron (right). Scale bar, 10 μm. E, Quantification of normalized 405/480 ratio in growth cones of WT RGCs before and 30 min after treatment with 100 μm H2O2, which caused significant increase in growth cone H2O2 levels. Data are presented as mean ± SEM; n = 35 indicates number of growth cones; p = 0.0009; Wilcoxon matched pairs test. F, Growth cone H2O2 levels are not significantly different between WT (n = 33) and nox2/cybb−/− (n = 25) RGC neurons (p = 0.46; Mann–Whitney test).
