Figure 3.

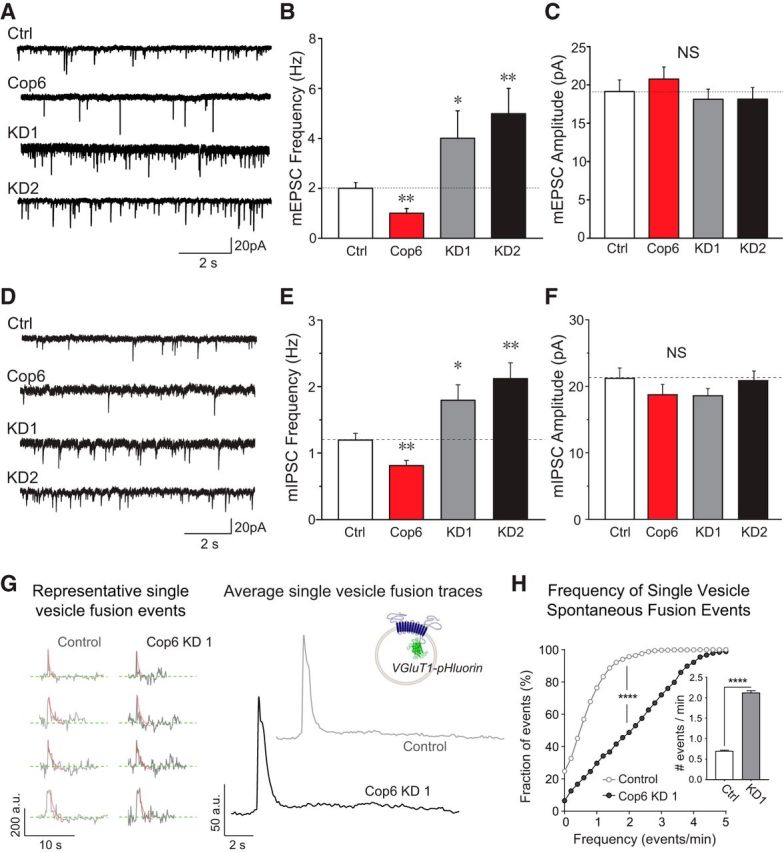
Copine-6 suppresses presynaptic spontaneous vesicle fusion. A, Example traces of mEPSC recording from control hippocampal neurons (Ctrl), neurons overexpressing copine-6 and copine-6 knockdown shRNA constructs (KD1 and KD2) in the presence of 2 mm Ca2+. B, C, Quantification of mEPSC frequency (B) and amplitude (C) from control, copine-6 overexpression, and copine-6 KD neurons. Overexpressing copine-6 suppressed mEPSC frequency and knockdown of copine-6 increased mEPSC frequency (Ctrl, 2.0 ± 0.2 Hz, n = 16; HA-Cop6, 1.0 ± 0.2 Hz, n = 15, p = 0.002; KD1, 4.0 ± 1.1 Hz, n = 11, p = 0.04; KD2, 4.9 ± 1.1 Hz, n = 9, p = 0.001). The average amplitudes of each condition were not significantly different (19.1 ± 1.5 pA for Ctrl, 20.8 ± 1.6 pA for HA-Cop6, 18.1 ± 1.3 pA for KD1, and 18.1 ± 1.5 pA for KD2). D, Example traces of mIPSCs recorded in noninfected control (Ctrl), copine-6 (Cop6) overexpression, and copine-6 knockdown (KD1 and KD2) hippocampal neurons in the presence of 2 mm Ca2+. E, F, Quantification of average mIPSC frequency (E) and amplitude (F) of the cells as mentioned in A. Copine-6 overexpression resulted in suppression on spontaneous release rate with no change of amplitudes. Ctrl,1.2 ± 0.1 Hz, 21.2 ± 1.6 pA, n = 14; Cop6, 0.8 ± 0.1 Hz, 18.7 ± 1.6 pA, n = 14; L307, 1.1 ± 0.2 Hz, 18.2 ± 1.2 pA, n = 11; KD1, 1.8 ± 0.2 Hz, 18.6 ± 1.1 pA, n = 15, KD2, 2.1 ± 0.2 Hz, 20.9 ± 1.4 pA, n = 15. G, Left, Representative single-vesicle fusion spontaneous fusion events measured with vGlut1-pHluorin in control (light gray) and copine-6 KD (black) neurons. Right, Average fluorescence traces from single-vesicle spontaneous fusion events in control neurons (light gray) and copine-6 KD neurons (black). Inset, Schematic of vGlut1-pHluorin fusion protein in a synaptic vesicle. H, Cumulative histogram of frequency of single-vesicle spontaneous fusion events for control and copine-6 KD neurons. Cumulative distributions were compared using Kolmogorov–Smirnov test. ****p < 0.0001. Inset, Bar graph represents the average number of events per minute for both conditions: control, 0.70 ± 0.02 events/min, copine-6 KD, 2.12 ± 0.04 events/min. Means were compared using Mann–Whitney test. ****p < 0.0001. Data from 5 independent cultures. Control, 1237 boutons from 12 coverslips; copine-6 KD, 976 boutons from 7 coverslips. *p < 0.05. **p < 0.01.
