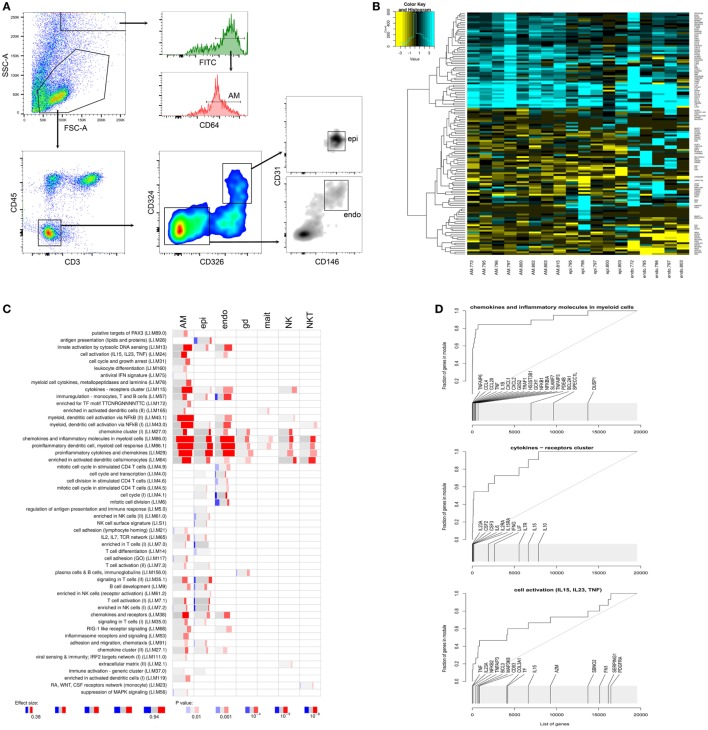
Figure 3.
Analysis of distinct pulmonary cells. (A) Gating strategy for alveolar macrophages, epithelial cells (epi), and endothelial cells (endo). (B) Heatmap displaying log2 fold differences between cells from infected and uninfected for each donor. Shown are unique transcripts from a combined list of the top 50 differentially expressed transcripts for each cell type. (C) tmod gene module enrichments in innate pulmonary cells from infected versus uninfected tissue. gd, γ/δ T cells; mait, mucosal associated invariant T (MAIT) cells; natural killer (NK) and natural killer T (NKT) cells. (D) tmod evidence plots showing ranking of individual genes from three prominently enriched gene modules in panel (C). A high resolution version of this figure is supplied as Figure S5 in Supplementary Material.

