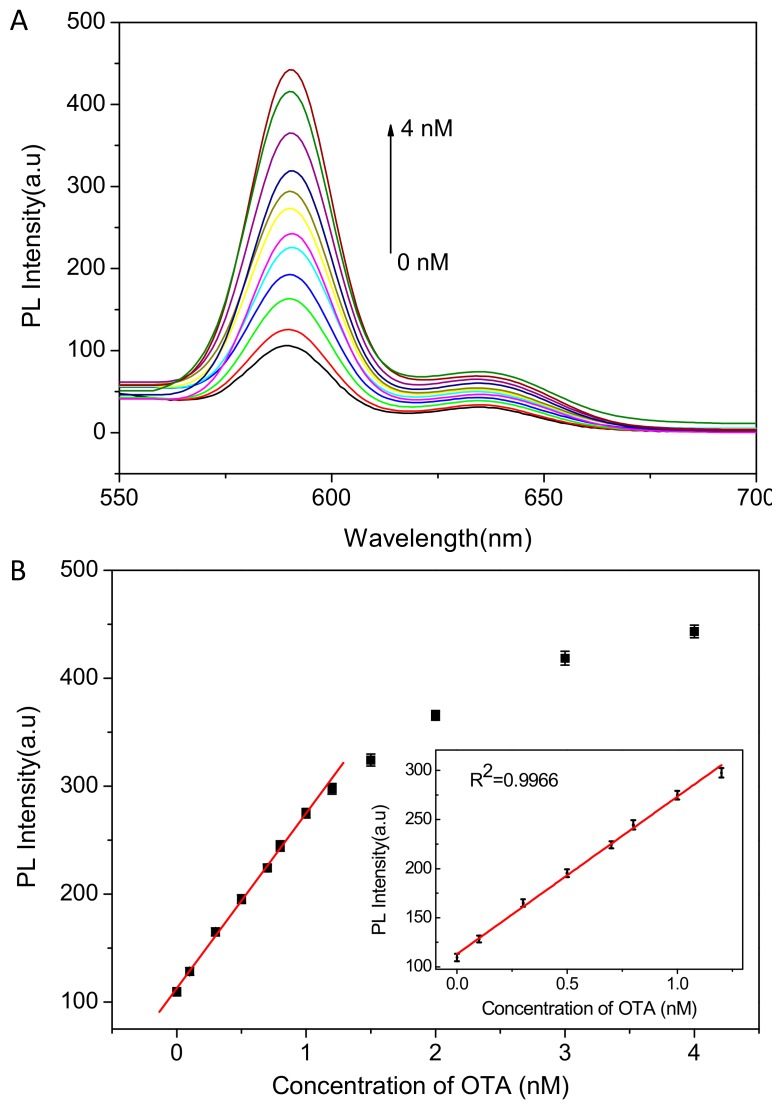
Figure 4.
(A) Emission spectra of the assay system with different concentrations of OTA from 0~4 Nm; (B) The relationship between fluorescent intensity and OTA concentration. Inset: linear plot of fluorescent intensity vs. OTA concentration. Error bars show the standard deviations of three independent measurements (λex = 430 nm).

