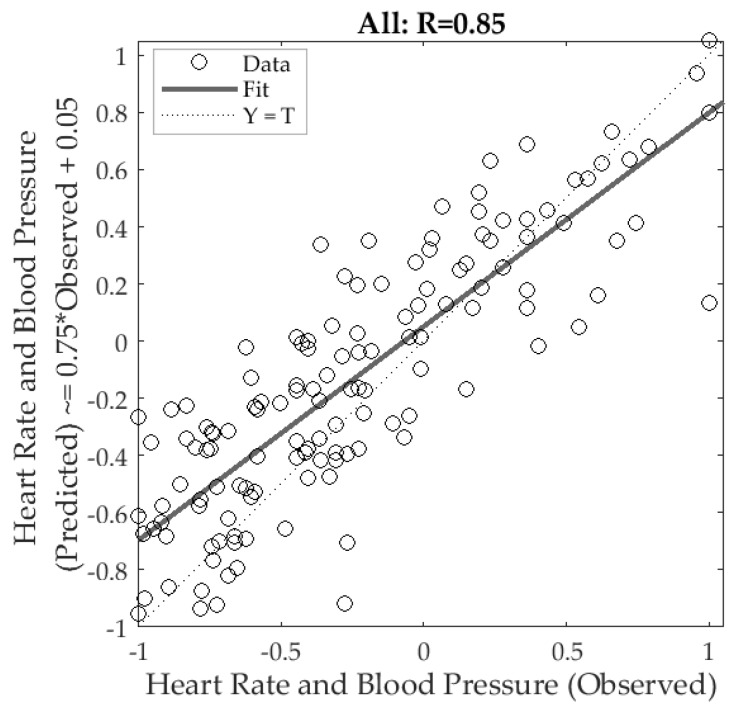
Figure 7.
The artificial neural network regression overall model (Model 1) showing a high correlation coefficient (R = 0.85), where the x-axis represents the observed (targets) and the y-axis represents the predicted (outputs) values of heart rate (HR) and blood pressure (BP) measured with the oscillometric monitor. All values were normalized in a scale from −1 to 1.

