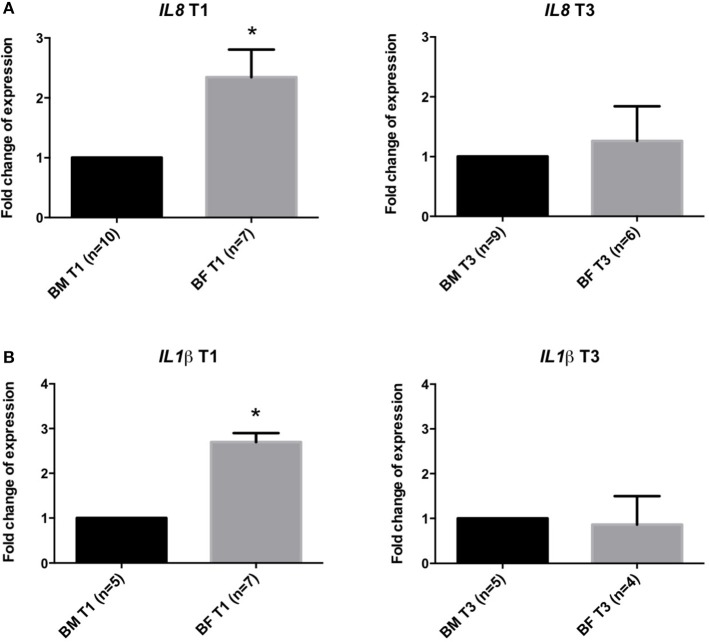
Figure 2.
Gene expression analysis in stool samples of infants fed with BM or BF. Gene expression at timepoints T1 and T3 of IL8 (A,B) and IL1β genes in stool samples from BF group compared to BM group. Changes in cycle threshold (ΔCT) values for each gene, normalized to GAPDH gene, were obtained at T1 and T3. The mean of the ΔCT of BM group was used as a control for the ΔCT expression in the BF group compared to the BM group. *p < 0.05.

