Figure 4.

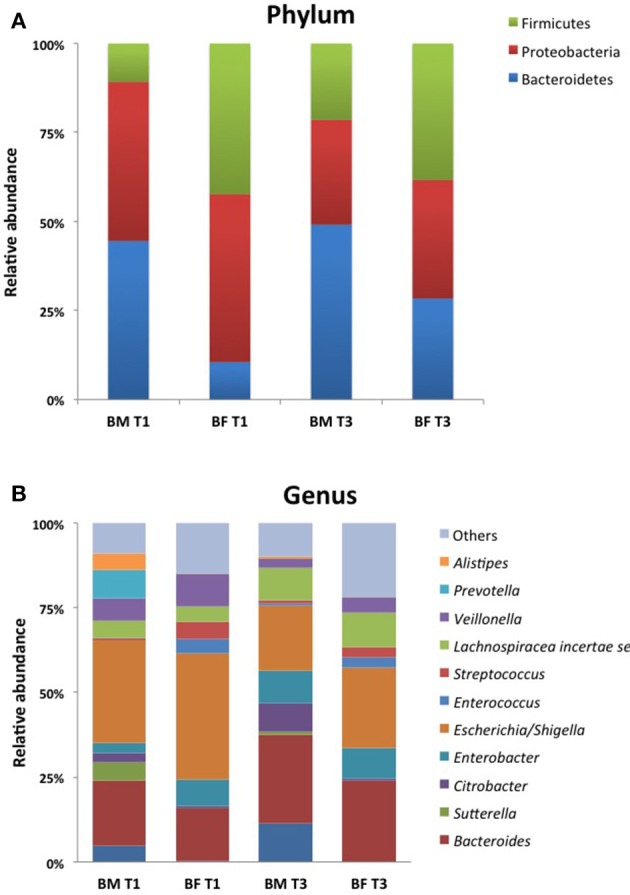
Community profile at different taxonomic levels. Relative abundance of taxa at Phylum (A) and Genus (B) level of the 10 most abundant taxa. Each color represents a different taxonomic unit. Less representative taxa were grouped as “other”.

Community profile at different taxonomic levels. Relative abundance of taxa at Phylum (A) and Genus (B) level of the 10 most abundant taxa. Each color represents a different taxonomic unit. Less representative taxa were grouped as “other”.