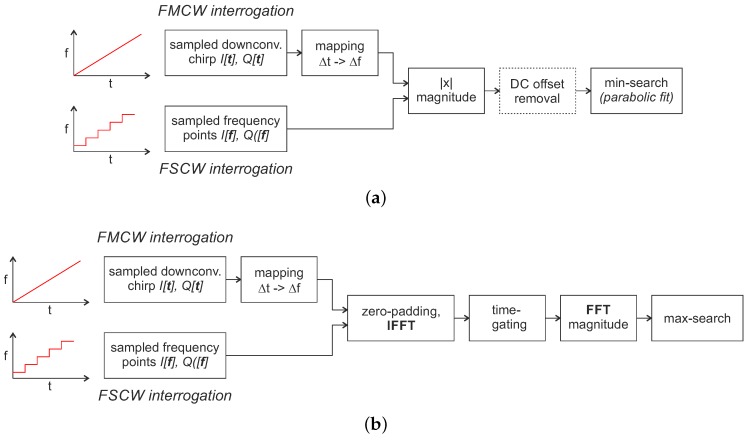
Figure 5.
Signal processing flow chart for frequency domain sampling with resonant SAW sensors. (a) direct calculation of the resonance frequency from the sampled frequency points; (b) calculation of the resonance frequency using additional software time-gating to mask static reflections of the environment as well as mismatches and crosstalk within the front end.

