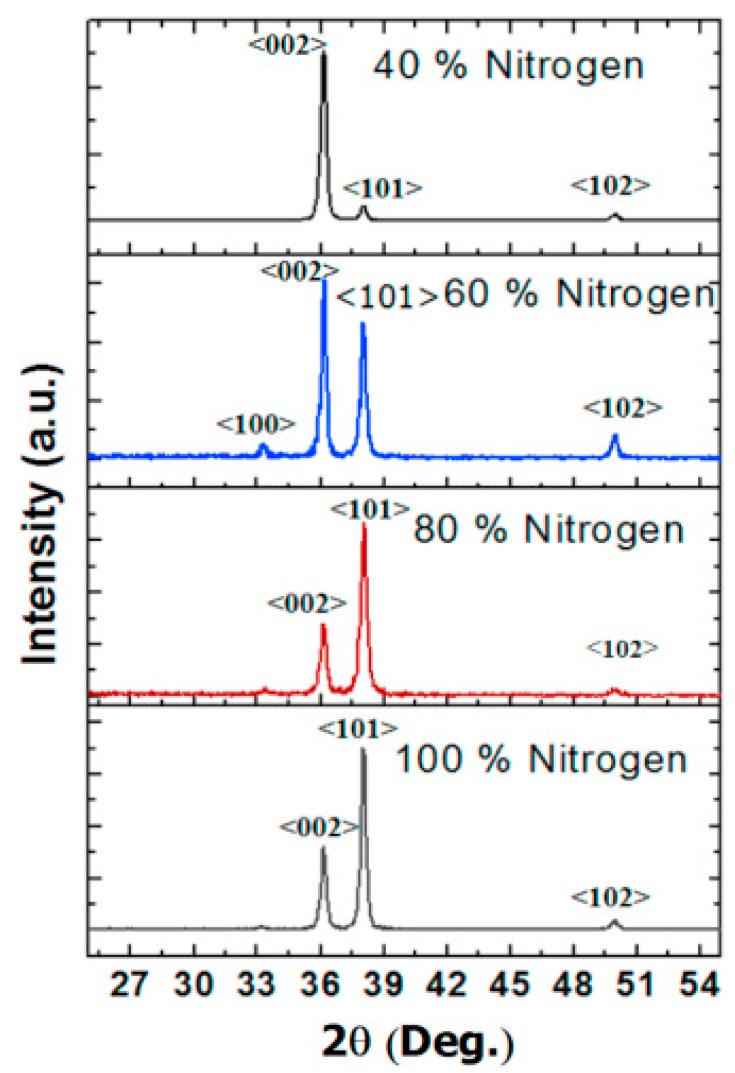
Figure 3.
The example of XRD plot of AlN films [8]. There are four panels in the figure, denoting the crystal orientations of four films that were deposited with different Nitrogen concentrations. The AlN peaks are (100), (101), (102) and (002). The y-axis has an arbitrary unit.

