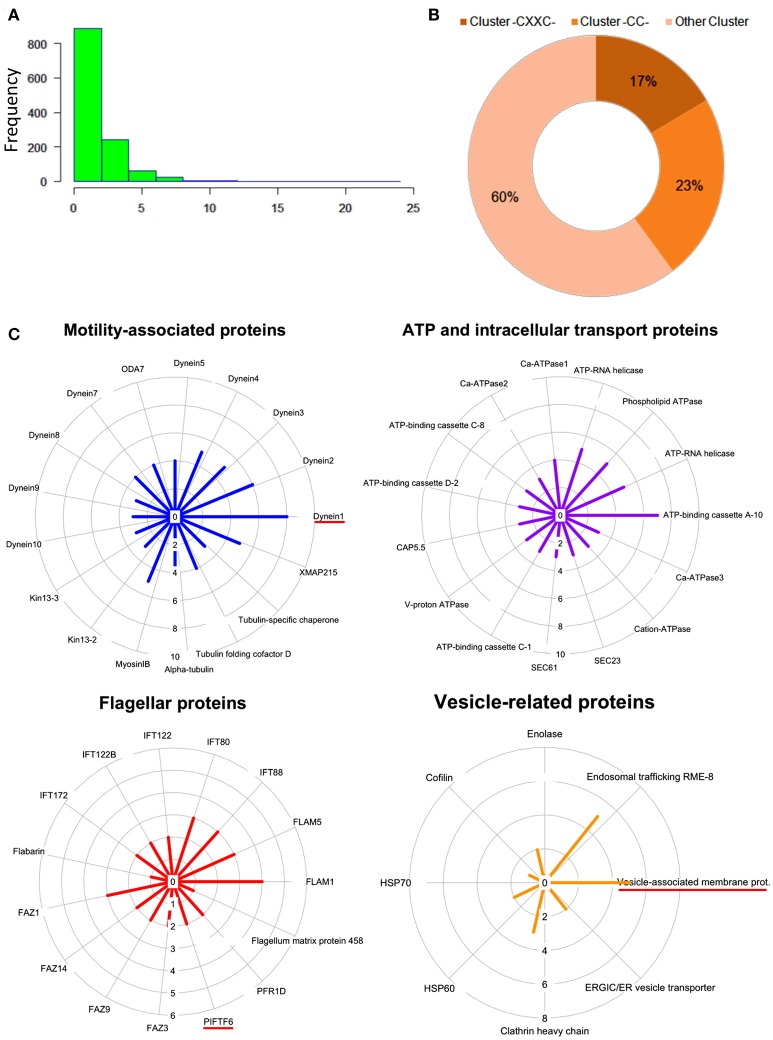
Figure 4.
(A) Histogram plot showing frequency of palmitoylation in all predicted palmitoylated proteins. (B) Representative doughnut plots showing the prevalence of three categories of predicted palmitoylated site clusters. (C) Circular plots showing shortlisted novel palmitoylated protein modules and their respective protein palmitoylation rates. The bar length in the circular plot indicates the protein expression level.

