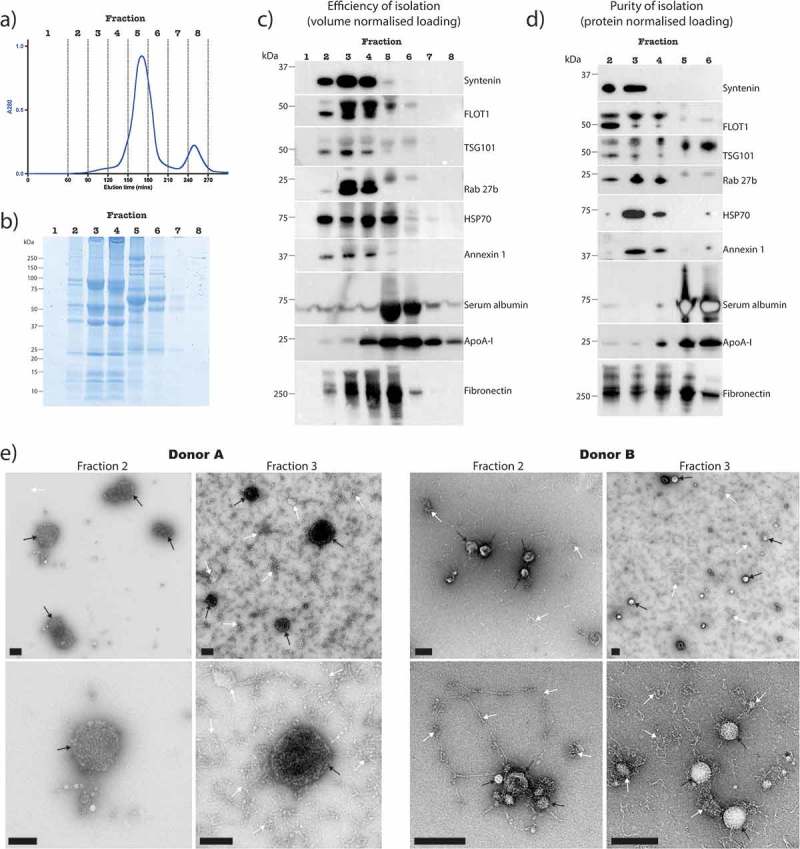
Figure 4.

Analysis of EV enrichment from synovial fluid by SEC.
(a) Chromatogram of absorbance at 280 nm versus elution time. SEC fractions were concentrated by ultracentrifugation at 100,000 x g and the resulting pellets assessed for: (b) protein abundance by SDS PAGE plus Coomassie staining, with loading proportional to fraction volume, (c) the presence and abundance of EV markers, serum albumin, ApoA-I and Fibronectin by Western blot, with loading proportional to fraction volume, and (d) the purity of the EV enrichment by Western blot with equal protein amount loaded into each well (fractions 1, 7 and 8 were not assessed due to insufficient amounts of protein). Results are from the same SF sample that was used for Figures 2b and 3b, and are representative of results observed with other donors. (e) Negative staining TEM analysis of non-concentrated SEC eluent from two separate donors, containing a mixture of EVs (black arrows) and contaminating material (white arrows). Scale bars = 200 nm.
