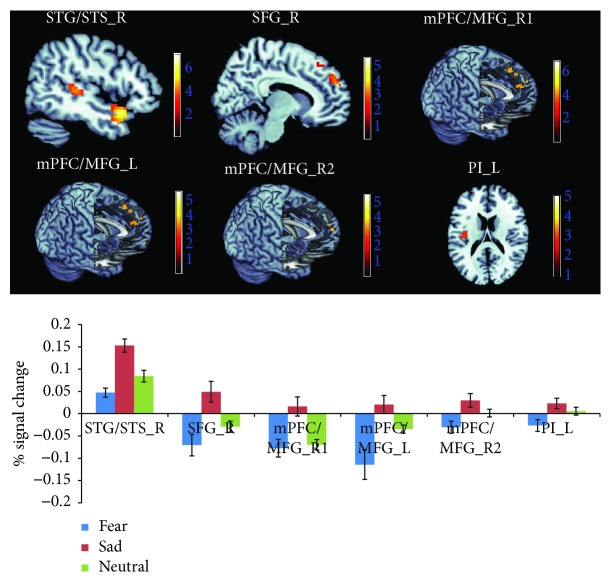
Figure 6.
Neuroimaging results showing brain activation associated with sadness induction (i.e., watching movies). The activation of the STG/STS_R and SFG_R was taken from the conjunction analysis of “sadness > neutral” and “sadness > fear” (depicted at p < 0.001), the activation of the mPFC/MFG_R1 and mPFC/MFG_L was taken from the contrast of “sadness > fear”, the activation of the mPFC/MFG_R2 was taken from the contrast of “sadness > neutral” (depicted at p < 0.05), and the activation of PI was taken from the contrast of “sadness > fear” (depicted at p < 0.005). The graphs show the mean percent signal changes separately for the STG/STS_R, SFG_R, mPFC/MFG_L, mPFC/MFG_R2, and PI_L across the three experimental conditions.

