
Figure 11.
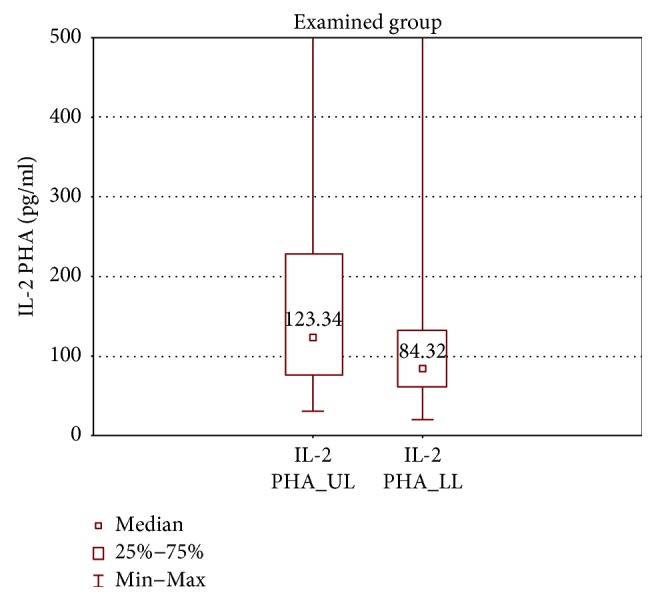
Comparison of IL-2 concentrations between the upper (IL-2 PHA_UL) and lower limb samples (IL-2 PHA_LL) of the examined group after PHA stimulation.
Official websites use .gov
A
.gov website belongs to an official
government organization in the United States.
Secure .gov websites use HTTPS
A lock (
) or https:// means you've safely
connected to the .gov website. Share sensitive
information only on official, secure websites.
Comparison of IL-2 concentrations between the upper (IL-2 PHA_UL) and lower limb samples (IL-2 PHA_LL) of the examined group after PHA stimulation.