
Figure 15.
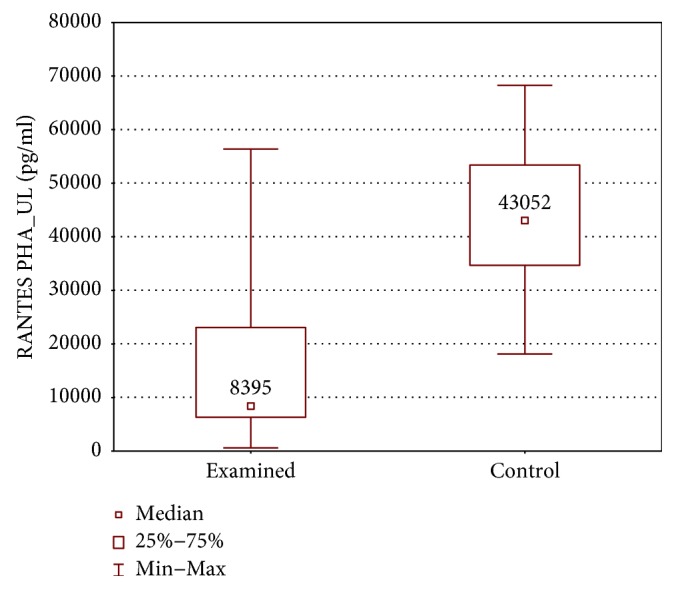
Comparison of RANTES concentrations between the upper limb samples of the examined and control group, cultured with PHA stimulation (RANTES PHA_UL).
Official websites use .gov
A
.gov website belongs to an official
government organization in the United States.
Secure .gov websites use HTTPS
A lock (
) or https:// means you've safely
connected to the .gov website. Share sensitive
information only on official, secure websites.
Comparison of RANTES concentrations between the upper limb samples of the examined and control group, cultured with PHA stimulation (RANTES PHA_UL).