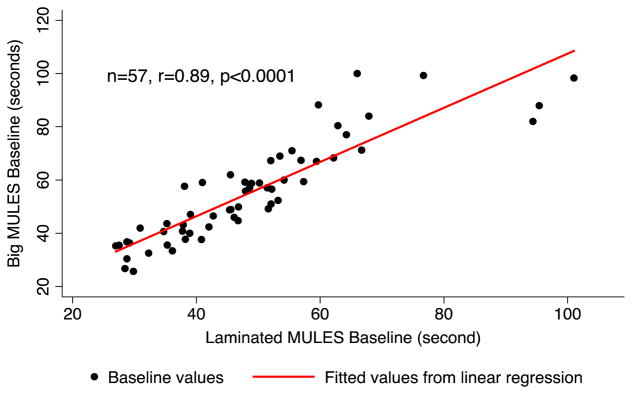
Fig. 4.
Scatter plot of big vs. laminated MULES baseline scores for participants who completed both test versions (n = 57). Linear correlation demonstrates strong agreement between baseline scores of each version (r = 0.89, p < 0.0001). Accounting for participant age, big MULES scores were significant predictors of time scores for the new laminated version (p < 0.001, linear regression).

