| Default parameters |
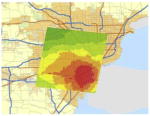
Year 2000–2013 PM2.5 and ozone monitoring data for the contiguous U.S. Voronoi Neighborhood Average interpolates to user-specified grid Grids defined for common air pollution models
|
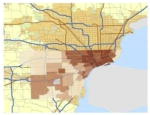
U.S. population stratified by sex/age/race/ethnicity Population projected from 2000 to 2050 in 1-year increments Aggregated from census blocks to 12 km grid cells
|
|
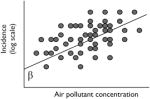
Over 100 PM2.5 and ozone health impact functions (β) for mortality, hospital admission, emergency department, exacerbated asthma, acute respiratory symptoms, school/work loss days
|
|
| Updating parameters |
Import .csv or .xlsx file specifying air quality modeling or monitoring data. As needed, import shapefile boundary defining location of air quality impacts
|
|
|
Import .csv or .xlsx file specifying health impact function(s), including health endpoint, functional form, effect coefficient, applicable age/sex/race/ethnicity
|
|