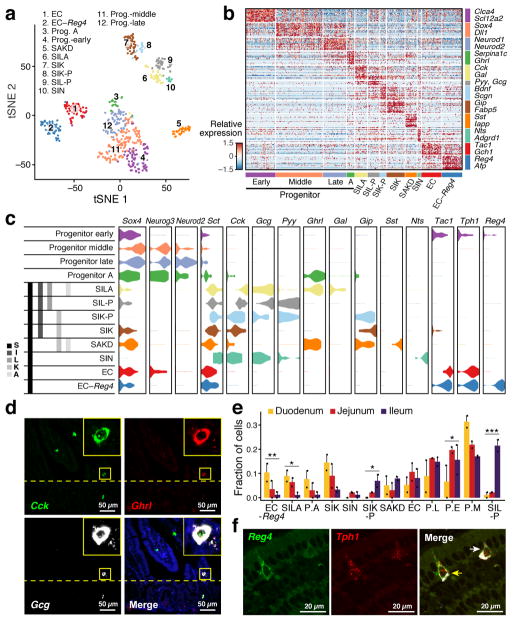
Figure 3. EEC taxonomy.
a. unsupervised clustering. tSNE of 533 EECs colored by sub-cluster. (n=8 mice) b. EEC subtype signatures. Relative expression of subtype-enriched genes (FDR < 0.01, rows) across cells (columns). c. Hormone-based EEC classification. Distribution of expression (x axis) of EEC TFs and hormones (columns) in cells from each subset (rows). Grey bars: traditional nomenclature by hormone expression. d. smFISH of Cck (green), Ghrl (red) and Gcg (white). Scale bar, 50μm. Inset (x5): triple-positive SILA cell e. Regional distribution of EEC subsets. Proportion (y axis) of each subset in the three regions (n=2 mice). P.A: Prog. -A, P.L: Prog. –late, P.E: Prog. –early, P.M: Prog. –middle. Error bars: SEM. * FDR<0.25, ** FDR<0.1, *** FDR<0.01, χ2 test (Methods) f. Enterochromaffin heterogeneity. smFISH of Reg4 (green) and Tph1 (red) co-stained with IFA of ChgA (white). Yellow and white arrows: Tph1+/Reg4+ and Tph1+/Reg4− EECs respectively. Scale bar: 20μm.

