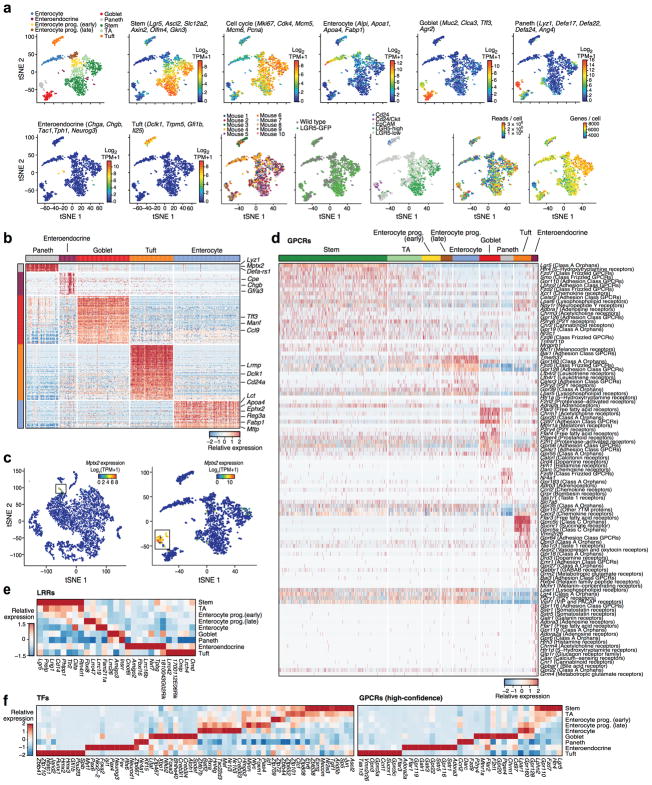
Extended Data Figure 2. Identification and characterization of intestinal epithelial cell types in plate-based full-length scRNA-seq data by unsupervised clustering, related to Figure 1.
a. QC metrics and post-hoc cluster annotation by the expression of known cell type markers. tSNE visualization of 1,522 single cells where individual points correspond to single cells. Top left corner to bottom right corner, in order: Cells are colored by their assignment to clusters, using a k-nearest neighbor (kNN) graph-based algorithm (Methods; Legend shows the cluster post-hoc annotation to cell types); mean expression (log2(TPM+1), color bar) of several known marker genes for a particular cell type or state (indicated on top; same as in Extended Data Fig. 1g); the mouse from which they originate (color legend) and its genotype, the FACS gate used to sort them (color legend), the number of reads per cell (color bar) and the number of genes detected per cell (color bar). n=8 mice. b. Cell-type-specific signatures. Heatmap shows the relative expression level (row-wise Z-scores, color bar) of genes (rows) in consensus cell-type-specific signatures (same genes as Figure 1c, with the exception of enterocytes), across the individual post-mitotic IECs (columns) in the full-length scRNA-seq data. Color code marks the cell types and their associated signatures. c. Mptx2, a novel Paneth cell marker. tSNE of the cells from the droplet-based 3′ scRNA-seq (left, as in Fig. 1b) and plate-based full-length scRNA-seq (right, as in a) datasets, colored by expression (log2(TPM+1), color bar) of the mucosal pentraxin Mptx2. d. Cell-type-enriched GPCRs. Heatmap shows the relative expression (row-wise Z-scores, color bar) of genes encoding GPCRs (rows) that are significantly (FDR < 0.001, Mann-Whitney U-test, Methods) up- or down-regulated in the cells (columns) in a given cell type (top, color coded as in a) compared to all other cells, in the plate-based full-length scRNA-seq data. e. Cell-type-specific Leucine-rich repeat (LRR) proteins. Heatmap depicts the mean relative expression (column-wise Z-score of mean log2(TPM+1) values, color bar) of genes (columns) encoding LRR proteins that are significantly (FDR < 0.001, Mann-Whitney U-test) up- or down-regulated in a given cell type (rows) compared to all other cells, in the plate-based full length scRNA-seq data. f. Cell type TFs and GPCRs. Average relative expression (Z-score of mean log2(TPM+1), color bar) of the top TFs (left) and GPCRs (right, columns) enriched in each cell type (rows).

