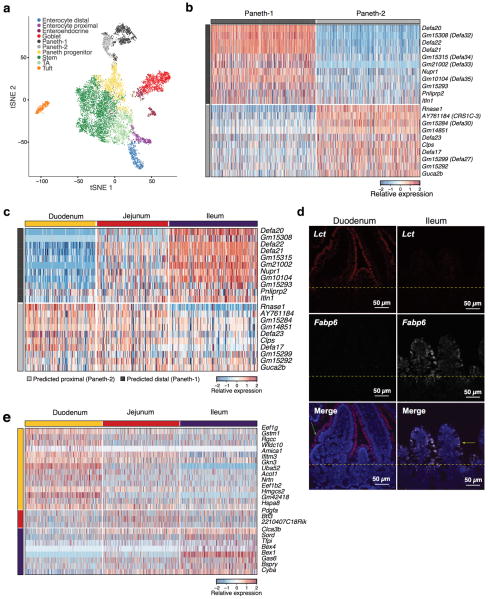
Extended Data Figure 3. Regional variation in Paneth cell sub-types and stem cell markers.
a,b. Paneth cell subsets. (a) tSNE of 10,396 single cells (points) obtained using a large cell-enriched protocol (Methods), colored by clusters annotated post-hoc. n=2 mice. b,c. Paneth cell subset markers. (b) Expression (row-wise Z-score, color bar) of genes specific (FDR<0.05, Mann-Whitney U-test, log2 fold-change > 0.5) to each of the two Paneth cell subsets (average of 724.5 cells per subtype, down-sampled to 500 for visualization) shown in (a). c. Two Paneth subsets reflect regional diversity. Expression of the same genes (rows) as in (b) in Paneth cells from each of three small intestinal regions (176.3 cells obtained per each of the regions on average, columns; Fig. 2a); 11 of 11 Paneth-1 markers are enriched in the ileal Paneth cells, while 7/10 Paneth-2 markers are enriched in duodenal or jejunal Paneth cells (FDR <0.05, Mann-Whitney U-test). d. Validation of regional enterocyte markers. smFISH of Lct (red) and Fabp6 (white) in the duodenum (proximal, left) and ileum (distal, right). Dotted line: boundary between crypt and villi, green and yellow arrows: proximal and distal enterocytes, respectively. Scale bar, 50μm. e. Regional variation of intestinal stem cells. Expression (row-wise Z-score) of genes specific to stem cells from each intestinal region (FDR<0.05, Mann-Whitney U-test, log2 fold-change > 0.5). There are 1,226.3 obtained cells per each of the three regions on average, down-sampled to 500 for visualization (columns).

