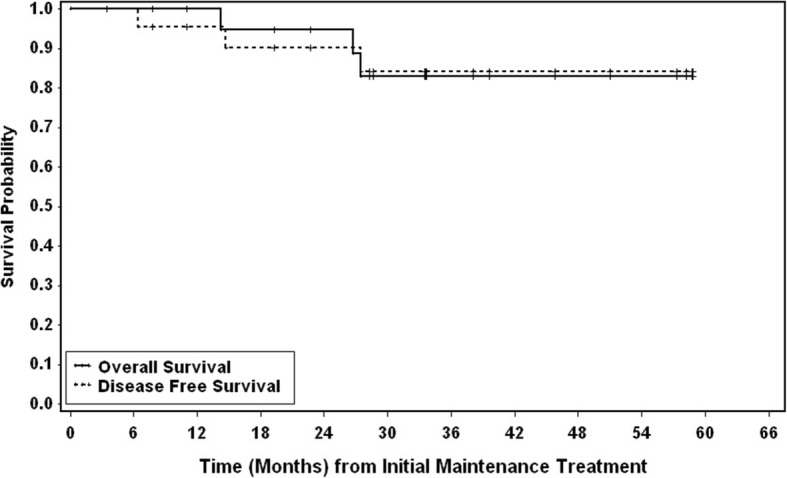
Fig. 1.

Kaplan-Meier analysis of disease-free and overall survival. The solid line represents overall survival, and the dotted line represents disease-free survival. DFS was calculated from start of treatment to the date of first appearance of disease relapse, or death from any cause. DFS and OS were estimated using the product-limit method of Kaplan and Meier; 95% confidence interval was calculated using Greenwood’s formula
