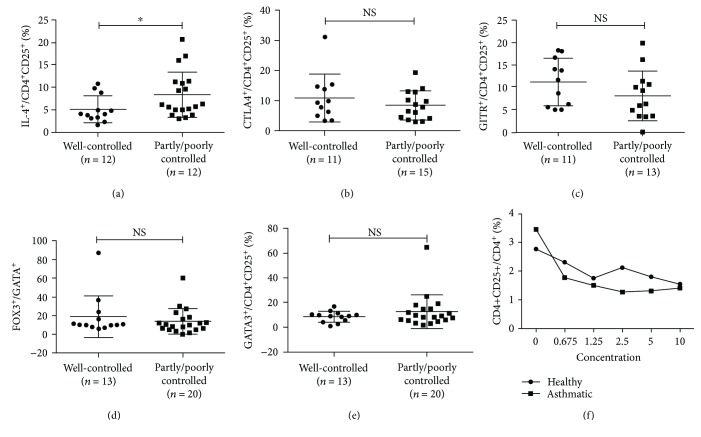
Figure 4.
The expression of various markers in Treg cells in well-controlled and partly/poorly controlled groups. (a, c, d, e, f) Frequencies of IL-4, CTLA-4, GITR, FOXP3, and GATA3 expressing in well-controlled and partly/poorly controlled groups. (b) Effect of different IL-4 concentrations on TGF-beta induction of Treg cells from naïve T cells of healthy (n = 8) and asthmatic (n = 18) groups. The graph shows means ± sem. ∗p < 0.05. NS: no significance.

