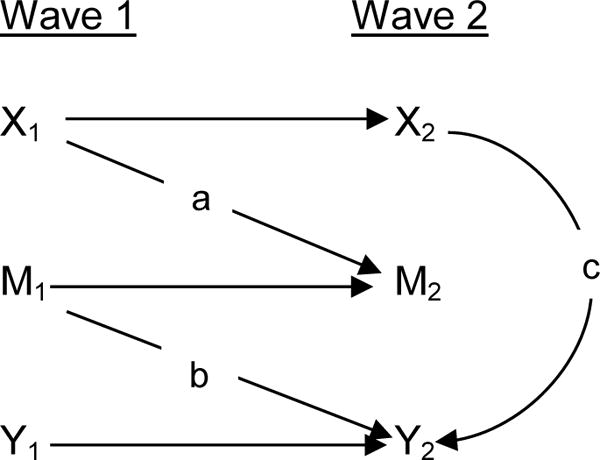
Figure 1. Conceptual Model for Mediation Analysis.

aPathway ‘a’ shows the effect of PM2.5 (X1) on mediators in Wave 2 (M2), controlling for mediators in Wave 1 (M1)
bPathway ‘b’ shows the mediators’ effects on CCFM (Y2), controlling for cognitive test results in Wave 1 (Y1)
cPathway ‘c’ shows the effect of PM2.5 on CCFM with mediators included
