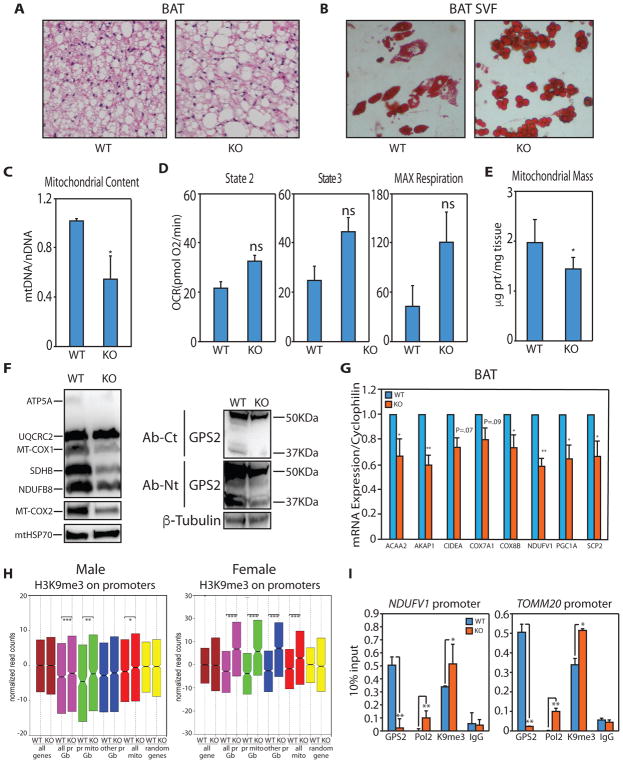
Figure 7. GPS2 regulates mitochondrial biogenesis in vivo in Brown Adipose Tissue.
(A) Increased lipid deposition in the BAT of GPS2-AKO by H&E staining.
(B) Oil Red O staining of in vitro differentiated adipocytes from BAT SVF.
(C) Decreased mtDNA content in the BAT of GPS2-AKO mice compared to WT littermates.
(D) Quantification of oxygen consumption rates (OCR) in BAT isolated mitochondria from chow-fed WT and GPS2-AKO littermates under the different respiratory states. Results represent average ± SEM for complex I-driven respiration (pyruvate-malate, n=6 mice per group), complex II-driven respiration (succinate-rotenone, n=6 mice per group).
(E) Reduced mitochondrial protein content in BAT isolated from GPS2-AKO compared to WT littermates.
(F) WB of mitochondrial proteins in BAT from GPS2-AKO and WT littermates. GPS2 deletion in GPS2-AKO mice is specific to mature adipocytes.
(G) RT-qPCR analysis of representative neMITO genes in the BAT of WT and KO mice.
(H) Box plot of H3K9me3 ChIPseq performed on BAT from WT and KO littermates showing a significant increase in H3K9me3 on neMITO and other GPS2-bound promoters in GPS2-AKO mice. In pink are represented all GPS2-bound promoters (all pr Gb), in green GPS2-bound mitochondrial promoters (pr mito Gb), in blue GPS2-bound non-mitochondrial promoters (other pr Gb), in red all mitochondrial promoters (all mito). Yellow represents a random set of genes.
(I) Increased promoter occupancy of POL2 and H3K9me3 by ChIP in GPS2-AKO BAT.
* indicate p-value<0.05; ** indicate p-value<0.01.

