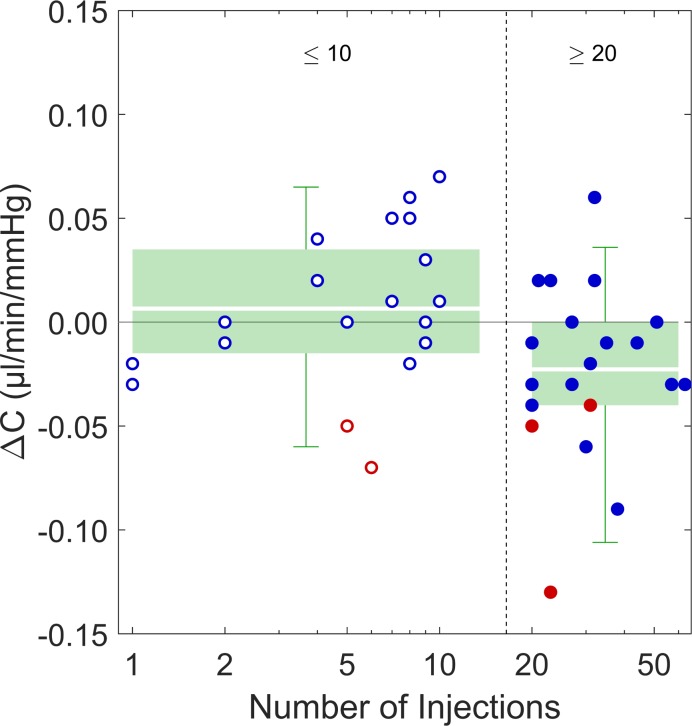
Figure 1.
Difference in outflow facility (ΔC) between injected eyes and fellow uninjected eyes, grouped by ≤10 injections (n = 20, hollow circles) and ≥20 injections (n = 22, filled circles). Blue data points indicate patients who were normotensive in the uninjected eye (IOP < 21 mm Hg); red data points indicate patients who were ocular hypertensive in the uninjected eye (IOP ≥ 21 mm Hg) in the uninjected eye. Green boxes indicate the inner interquartile range, error bars indicate the range encompassing 95% of measured values, while white lines through the boxes represent the mean values. ΔC < 0 indicates a lower outflow facility in the injected eye.

