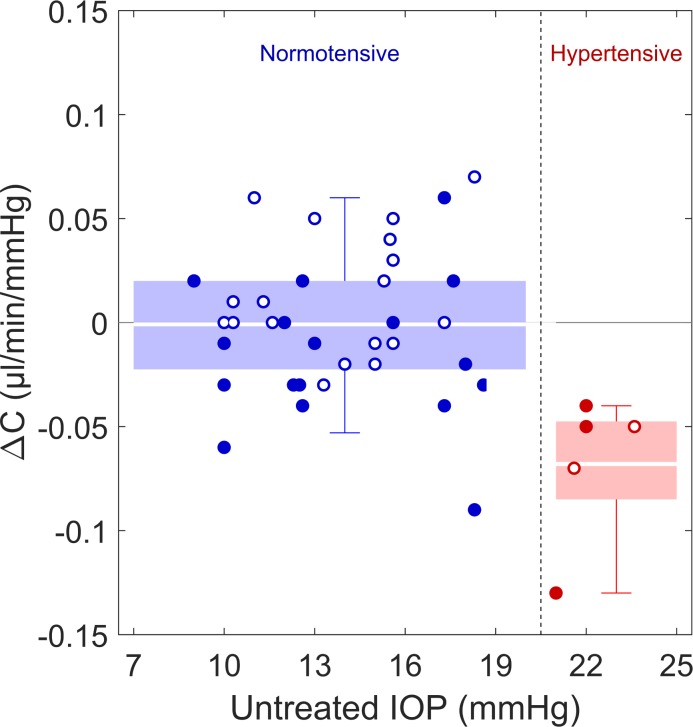
Figure 2.
Difference in outflow facility (ΔC) between injected eyes and fellow uninjected eyes, grouped by IOP of the uninjected eye (blue, normotensive ≤ 21 mm Hg; red, hypertensive > 21 mm Hg). Hollow circles received ≤ 10 injections and filled circles received ≥ 20 injections. Box plots defined as in Figure 1.

