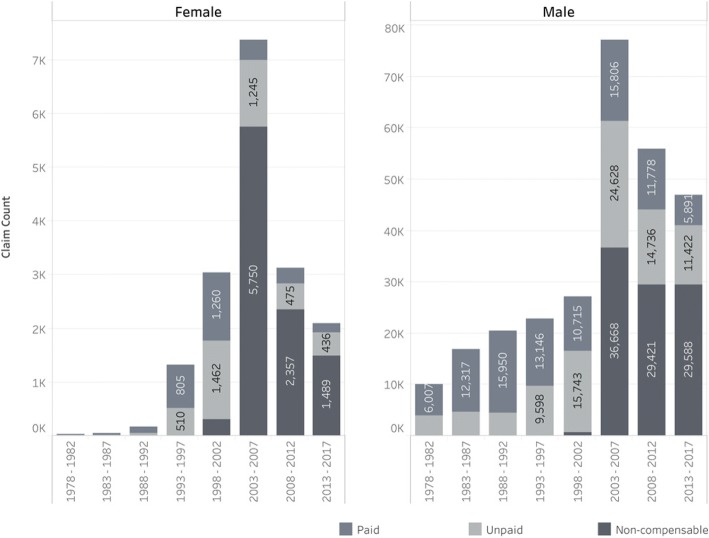
Fig. 4.
Number of claims, separated by gender, grouped into 5-year periods from 1978 to 2017, shaded by the payment status. aNote the different y-axis scales between females and males; there are approximately ten-fold the number of male compared to female claims. (Records where gender was not recorded were excluded)

