
Fig. 2.
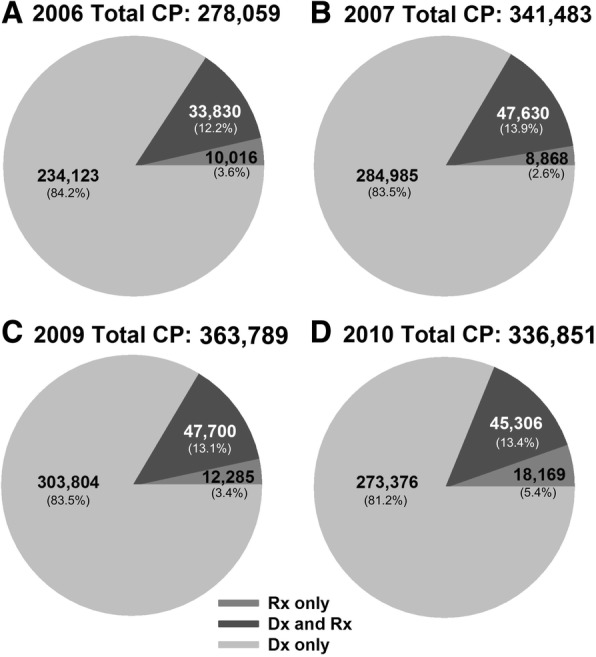
Distribution of cohort identification criteria. Pie charts represent the total number and percent (within parentheses) of patients who met the ICD-9 code parameters, opioid parameters, or ICD-9 code plus opioid parameters, as described in the Methods section. Parameters are reported for years 2006 (a), 2007 (b), 2009 (c), and 2010 (d)