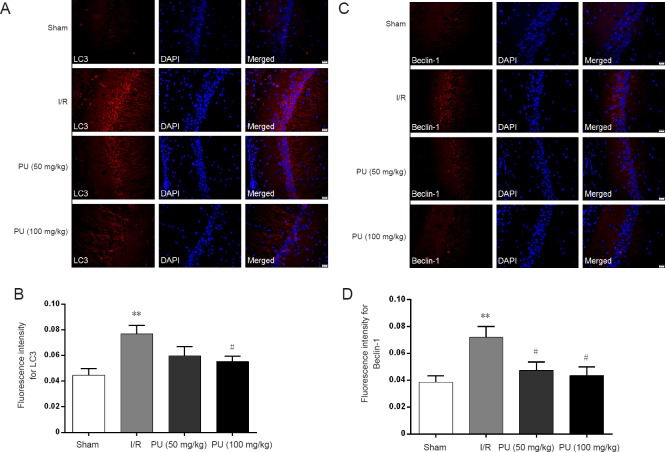
Figure 4.
Effects of puerarin on LC3 and Beclin-1 expression in the hippocampal CA1 area after 24 hours of reperfusion.
(A) LC3-positive (red) neurons. The blue is DAPI staining. (B) Mean fluorescence intensity for LC3. (C) Beclin-1-positive (red) neurons. The blue is DAPI staining. (D) Mean fluorescence intensity for Beclin-1. Data are expressed as the mean ± SEM (n = 3 rats per group) and were analyzed by one-way analysis of variance followed by the least significant difference test. **P < 0.01, vs. sham group; #P < 0.05, vs. I/R group. Images were captured at 400× magnification. Scale bars: 20 μm. PU: Puerarin; I/R: ischemia/reperfusion, LC3: light chain 3; DAPI: 4′,6-diamidino-2-phenylindole.

